
Reading a signal
Every forecast answers four questions: what is setting up, why it qualifies, when it applies, and where it points. Once you can read those four, you do not need a second tool to understand a setup.
Where forecasts appear
Forecasts appear in the Live Forecasts widget, a continuously updating feed of qualified setups across every market Radar 61 covers. Forex pairs, indices, crypto, commodities, and stocks appear in the same list and are ranked on the same terms.
Add the widget to any workspace from the Widget Store, or use the Live Forecasts shortcut on an empty workspace.
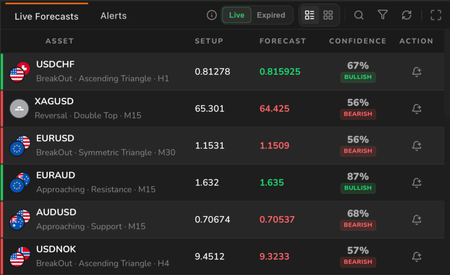 The Live Forecasts widget. Each row is a single forecast.
Anatomy of a forecast
Each row is laid out across five columns.

Column headers and a single forecast row.
| Column | What it shows |
|---|---|
| Asset | The instrument, with its method line underneath |
| Setup | The price level the structure is built on |
| Forecast | The price the structure projects toward |
| Confidence | The confidence score, with the direction below it |
| Action | Creates an alert from this forecast |
Not every column is visible at every width. Asset, Confidence, and Action always show; Setup and Forecast appear once the widget is wide enough.
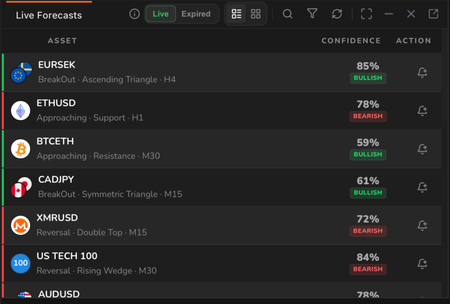 The same feed in a narrower widget. Setup and Forecast are hidden.
Reading the example above:
- USDCHF is the instrument.
- BreakOut · Ascending Triangle · H1 is the method line. It reads as the stage, then the detected pattern, then the timeframe.
- 0.81278 is the setup level.
- 0.815925 is the forecast target.
- 67% is the confidence score, and BULLISH below it is the direction.
Two things are colour coded. The forecast price is green when the direction is bullish and red when it is bearish, and the bar on the left edge of each row follows the same rule. This lets you scan the feed for direction without reading every badge.
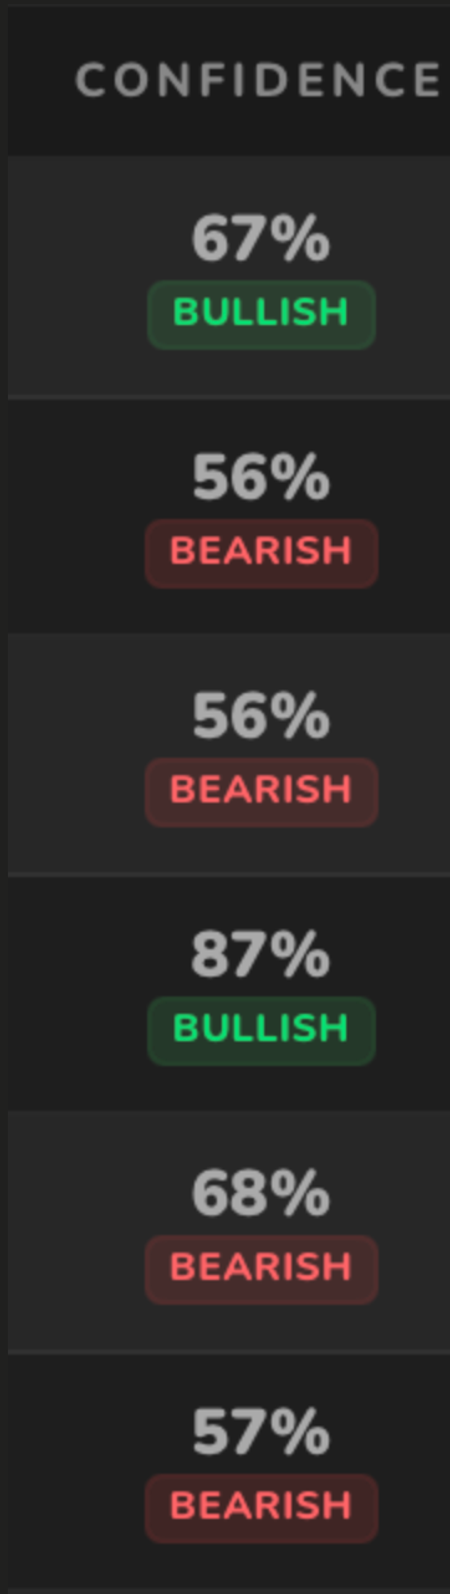
Confidence and direction share a column. Bullish forecasts are green, bearish red.
The same instrument can carry different forecasts on different timeframes, so check the timeframe before comparing two rows on the same market.
If the widget is narrow, the Setup and Forecast columns are hidden and only Asset, Confidence, and Action remain. Widen the widget, or pop it out into its own window, to see the levels.
Categories
The first item on the method line is the category the detected structure falls into. Three appear on the feed:
- Approaching. Price is moving toward a level that has not yet been met.
- BreakOut. Price has moved through the structure's trigger condition.
- Reversal. The structure points to a change in the prevailing direction. The category is paired with the specific pattern that follows it, so "Approaching · Support · M15" and "BreakOut · Ascending Triangle · H1" are both read left to right as category, then pattern, then timeframe.
Live and expired
Every forecast is valid for a defined window. It expires when the structure either completes or is invalidated.
Expired forecasts are not deleted. Switch the toggle at the top of the widget to see them, which is what makes it possible to look back over a session and review what resolved.
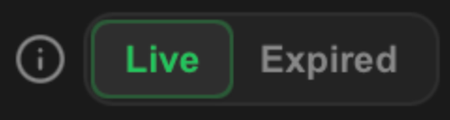
The Live and Expired toggle in the widget header.
Creating an alert from a forecast
The bell icon in the Action column turns that forecast into a standing alert, so you do not have to keep watching the feed.
The Action column. The bell icon creates an alert from that row.
See Alerts for the full set of alert conditions.
Important notes
Price data is delayed. The workspace status bar shows the current data status and the trading session alongside the clock. Check it before acting on a level.
A forecast target is a projection, not a prediction. It is the level the detected structure projects toward, not a statement about where the market will go.
Radar 61 handles detection, qualification, and monitoring. Judgement, position sizing, and execution remain yours.
Related
- Confidence scoring. How the percentage on each forecast is read.
- Alerts. Setting up standing alerts so forecasts come to you.
- Catalogue widget. Reference profiles for the patterns named on the method line.