
Catalogue Widget
The Catalogue is a practical reference for the trading methodologies Radar 61 detects and the mechanics behind them. Use it to look up a pattern you have seen on a forecast, to learn what a structure means, or to see which instruments are currently forecasting it.
Adding it to a workspace
Click Widget in the top bar and pick Catalogue, or choose Open Widget Store to add several widgets at once. On an empty workspace there is also a Catalogue shortcut below the Add Your First Widget button.
How it is organised
Patterns sit in a three level structure. A methodology such as Chart Patterns or Price Action contains groups, and each group contains the individual patterns.
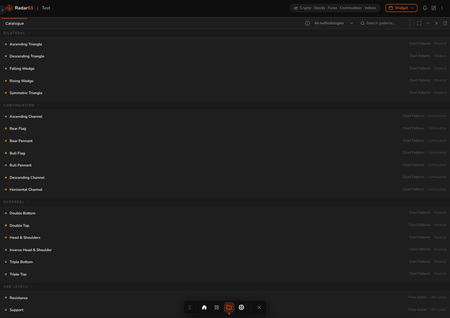
The Continuation group. Each row shows its methodology and group on the right.
Group headings carry a count, and patterns are alphabetical within each group. The label on the right of every row tells you where that pattern sits, for example "Chart Patterns · Continuation". When you filter to a single methodology, that part of the label drops away and only the group remains.
What is in the Catalogue
Twenty patterns across two methodologies.
Chart Patterns · Bilateral, patterns that can resolve in either direction:
- Ascending Triangle
- Descending Triangle
- Falling Wedge
- Rising Wedge
- Symmetric Triangle
Chart Patterns · Continuation, patterns that suggest the existing move carries on:
- Ascending Channel
- Bear Flag
- Bear Pennant
- Bull Flag
- Bull Pennant
- Descending Channel
- Horizontal Channel
Chart Patterns · Reversal, patterns that suggest the prevailing direction is changing:
- Double Bottom
- Double Top
- Head & Shoulders
- Inverse Head & Shoulder
- Triple Bottom
- Triple Top
Price Action · S&R Levels, price levels rather than shapes:
- Resistance
- Support
Radar 61 also detects patterns that do not appear in this list, including Cup and Handle, Rounding Bottom, and the harmonic family (ABCD, Bat, Butterfly, Crab).
Finding a pattern
Two controls sit in the widget header.
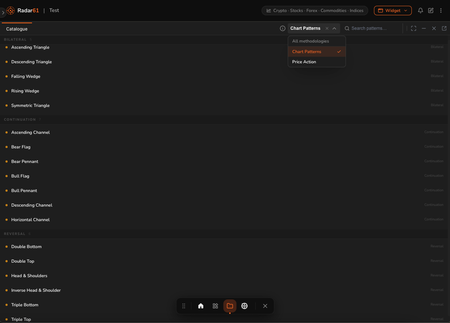
All methodologies narrows the list to a single methodology. Once one is selected, a small cross appears to clear it again.
Search patterns filters as you type. It matches the pattern name, its methodology, its group, and its description, so searching for a group name like "reversal" returns every pattern in that group.
 The methodology filter and pattern search in the header.
If nothing matches, the list shows "No patterns found."
Opening a pattern
Click any row to open the detail panel beside the list. The selected row stays highlighted. Close the panel with the cross beside the "Pattern Detail" label to return to the full width list.
The divider between the list and the panel can be dragged, so you can give whichever side you are working in more room.

The panel is laid out in four parts.
Structure
A labelled diagram of the pattern, showing the trendlines that define it, the breakout point, the measured move, and the projected target. Volume is drawn beneath the price action, since volume behaviour is part of how these structures confirm.
The same pattern shapes are drawn as overlays on the Chart widget, so a structure you learn here is recognisable when it appears on live price.
Two pills above the diagram summarise how the pattern behaves, for example a Falling Wedge is labelled Reversal and Breakout.
Beneath the diagram, Structure lists the rules that define the pattern. For a Falling Wedge these are its pattern type, the fact that both trendlines slope downward, the convergence of the upper and lower trendlines, the trigger (a close above the upper trendline), and the expected volume behaviour. One fact is highlighted in orange as the pattern's defining characteristic.
Forecast Target describes what the pattern projects and how the target is measured. Bilateral patterns show both a bullish and a bearish case, since either can occur.
What It Means
A plain language explanation of what the structure represents, the market psychology behind it, and what confirms it.
What To Look For
A checklist for confirming the pattern. Green ticks mark things to verify on the chart; amber markers are points to keep in mind, such as what triggers the measured move or when a pattern can behave differently depending on the prevailing trend.
Active Forecasts
Live forecasts currently running on that exact pattern, each showing the instrument, timeframe, how long ago it was found, and its confidence score. A count of live forecasts appears in the section header when there are any.
This is what makes the Catalogue more than a glossary. You can read what a Bull Flag is, then see every instrument forming one right now.
If nothing is running, the section reads "No active forecasts for this pattern."
Channel patterns have two views
Channels can break either with the trend or against it, so channel entries carry a toggle in the top corner of the detail panel. Use it to switch between the continuation case and the reversal case. Each view has its own diagram, description, and checklist.
The toggle resets when you move to a different pattern.
Diagrams are optional
Pattern diagrams can be turned off in Settings > Trading defaults. With diagrams off, the panel shows a reference image instead.
Widget controls
- Info. A short description of the widget and a Learn more link to this page.
- Expand to full width, Minimise, and Close.
- Pop out opens the Catalogue in its own window, which suits reading a pattern at length.
Important notes
The Catalogue is a reference, not a live feed. It lists what Radar 61 can detect rather than what is currently detected, apart from the Active Forecasts section on each pattern. For the full live feed, use the Live Forecasts widget.
Pattern names in the Catalogue match the names shown on the trading method line of a forecast, so anything you see on the feed can be looked up here.
Related
- Reading a Forecast. Where pattern names appear on a forecast.
- Live Forecasts widget. The live feed of detected setups.
- Alerts widget. Setting alerts on a specific pattern.