
Compass Strength Meter Widget
The Compass measures relative strength. Rather than looking at one instrument in isolation, it ranks a basket of them against each other, so you can see what is leading and what is lagging before deciding where to put your attention.
What you get on your plan
The Compass has six views and six baskets, and most of them are gated.
| Watch | Core | Pro | |
|---|---|---|---|
| Views | Ranked only | 3 | All six |
| Custom basket instruments | None | 5 | Unlimited |
Views you do not have show a padlock in the menu. Choosing Custom Basket on a plan that does not include it opens the upgrade screen instead.
A Provider / Team tier is also available, with limits agreed with the Radar 61 team.
Adding it to a workspace
Click Widget in the top bar and pick Compass, or choose Open Widget Store to add several widgets at once.
The control bar
Three dropdowns sit above the results, and they set what you are comparing, how, and over what period.
Basket
What is being compared.
| Basket | Contents |
|---|---|
| Forex (Majors) | The major currencies |
| Crypto (Top 8) | The largest cryptocurrencies |
| Stocks (Indices) | Large cap stocks |
| Indices (Global) | Major global indices |
| Commodities | Energies, metals, and agricultural |
| Custom Basket | Instruments you choose yourself |
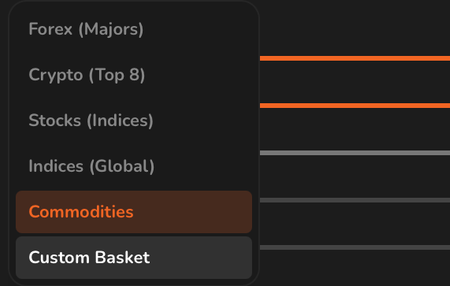 The basket menu.
View
How the comparison is presented.
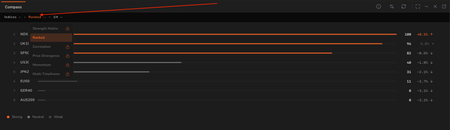 The view menu. Padlocks mark views your plan does not include.
| View | What it shows |
|---|---|
| Ranked | A leaderboard from strongest to weakest |
| Strength Matrix | Every instrument scored against every other |
| Correlation | Which instruments move together and which move apart |
| Price Divergence | Where price is moving against underlying strength |
| Momentum | Recent velocity rather than overall strength |
| Multi-Timeframe | Whether strength agrees across timeframes |
Timeframe
15m, 1H, 4H, or D1. Strength is measured over the period you choose, so an instrument can lead on 15m and lag on D1.
Reading the Ranked view
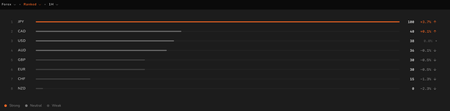
Caption: The Ranked view, showing commodities over one hour.
Each row carries a rank, the instrument, a bar, a score, and its change.
The score runs 0 to 100 and is relative, not absolute. The strongest instrument in the basket scores 100 and the weakest scores 0, every time. A score of 100 does not mean an instrument is strong in any general sense, only that it is the strongest of the ones being compared. Change the basket and the numbers change.
The percentage and arrow show how the instrument has moved over the selected timeframe.
The legend beneath the list marks Strong, Neutral, and Weak. Strong instruments are highlighted in orange.
Choosing your own instruments
The settings icon in the widget header opens a panel with the timeframe, the basket, and a searchable list of instruments with tick boxes.
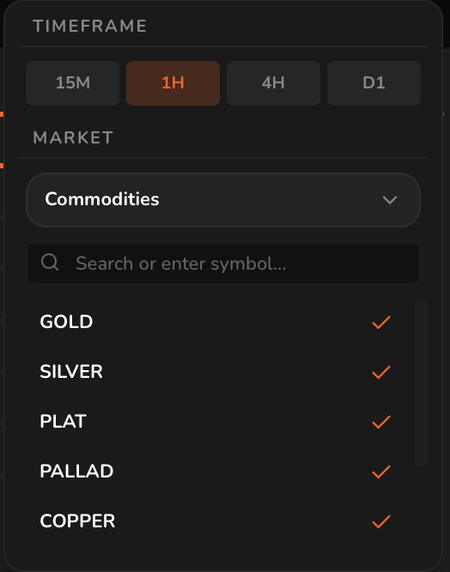 The settings panel.
This is where a custom basket is built. Search for an instrument or pick from the list, and the Compass compares exactly the set you chose.
Custom baskets require Core or above.
How to use it
The Compass answers a question the rest of the platform does not: not "is this setup valid" but "is this the instrument I should be looking at at all".
A common approach is to pair the strongest instrument in a basket with the weakest, on the reasoning that the gap between them is where the clearest move sits. Another is to check that a forecast you are considering sits on an instrument that is leading rather than lagging its peers.
Because the score is relative, it works best as a filter on where to look, rather than as a signal in itself.
Important notes
Scores are relative to the basket. Comparing a score from the Forex basket to one from Commodities means nothing.
Strength is not direction. An instrument can rank first while falling, if everything else is falling faster.
Related
- Live Forecasts widget. Detected setups on the instruments the Compass ranks.
- Chart widget. Chart an instrument once the Compass has pointed you at it.