
Chart Widget
The Chart widget is Radar 61's candlestick charting surface. It shows price for any covered instrument, carries the drawing tools you need to mark up a setup, and can be split into multiple panels so you can watch several timeframes at once.
What you get on your plan
The Chart itself is available on every plan, but how far you can split it and how many indicators you can apply are both limited.
| Watch | Core | Pro | |
|---|---|---|---|
| Chart panels | 1 | Up to 2 | Full layouts |
| Indicators per panel | 2 | See note | Unlimited |
| Drawing tools | Full | Full | Full |
| Watchlist instruments | 5 | 25 | Unlimited |
| Price feed | Delayed 15 minutes | Real time | Real time |
Drawing tools are not restricted. Every plan gets the full set.
A Provider / Team tier is also available for signal providers and trading communities. Its limits are agreed with the Radar 61 team rather than fixed, so they are not listed here.
Adding it to a workspace
Click Widget in the top bar and pick Chart, or choose Open Widget Store to add several widgets at once.
The chart panel
Every panel has its own controls along the top.
Symbol. Click the instrument name to change what the panel is showing. The instrument's icon appears beside the name.
Timeframe. M15, M30, H1, H4, and D1. The active timeframe is highlighted.
Note that the Chart offers D1 while the forecast engine scans up to H4, so a daily chart will not carry forecasts of its own.
Sync. The leftmost button sets the panel's sync group, which controls whether this panel follows the others in a split layout. What the panels share is set in the Chart Layout panel, covered below.
f(x) opens the indicator browser, and the button beside it changes how price is drawn.
Forecasts on the chart
When a forecast exists for the instrument and timeframe you are viewing, its levels are drawn directly on the price. The setup level and the forecast target are both labelled and priced, with a dotted line running to the target.
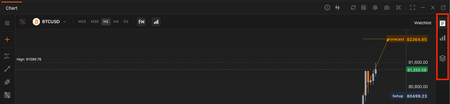
A forecast drawn on the chart, with its setup level and forecast target marked.
Indicators
Click f(x) to open the indicator browser. It has two tabs: Browse to add new indicators, and Applied to manage the ones already on the chart. A search box filters the list.
Indicators are split into two groups by where they render.
On the price chart, drawn over the candles:
Average Price, Bollinger Bands, Bull & Bear Index, Exponential Moving Average, Moving Average, Parabolic SAR, Smoothed Moving Average.
In a separate pane, drawn beneath the price:
Awesome Oscillator, Bias Ratio, BR & AR Sentiment, Commodity Channel Index, CR Energy Index, Difference of Moving Average, Directional Movement Index, Ease of Movement, MACD, Momentum, On-Balance Volume, Price & Volume Trend, Psychological Line, Random Index (KDJ), Rate of Change, Relative Strength Index, Triple Exponential Average, Volume, Volume Ratio, Williams %R.
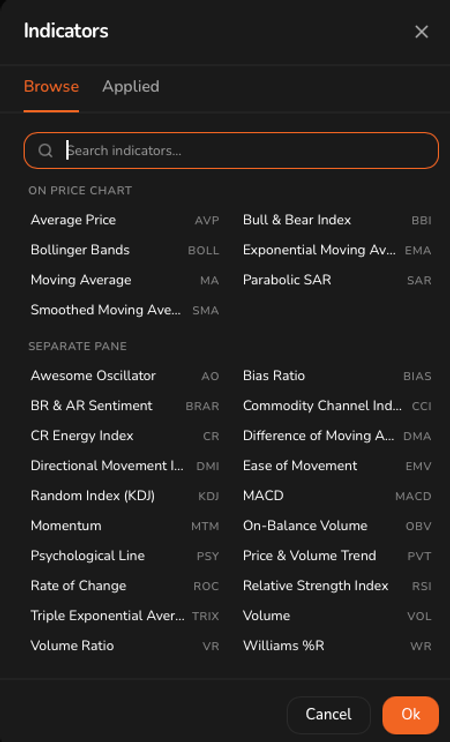
Caption: The indicator browser, grouped by where each indicator is drawn.
Each indicator in a separate pane carries its own controls in the pane header: hide it, open its settings, or remove it. The pane header also shows the indicator's parameters and current values, for example RSI(6,12,24) with each line's reading.
Remember the per panel limit on your plan. Watch allows two.
Split layouts
The layout button opens the Chart Layout panel, which offers arrangements from a single panel up to six, in various splits and grids.
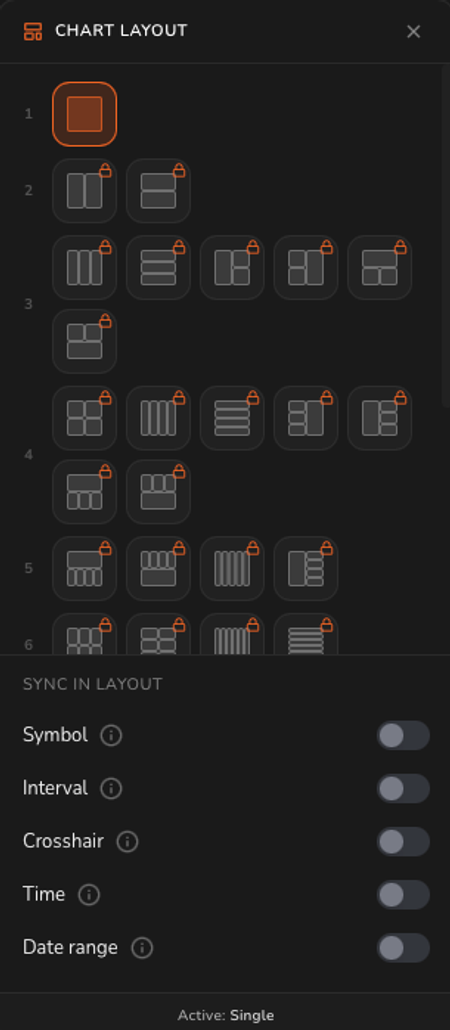 Caption: The Chart Layout panel. Layouts above your plan's limit show a padlock.
Layouts your plan does not include are marked with a padlock. On Watch only the single panel layout is available.
Sync in layout
Beneath the layouts, five toggles control what the panels share:
| Toggle | What it links |
|---|---|
| Symbol | All panels show the same instrument |
| Interval | All panels use the same timeframe |
| Crosshair | Moving the crosshair in one panel moves it in the others |
| Time | Panels stay aligned on the same point in time |
| Date range | Panels show the same span of history |
These are independent, which is the point. Sync the crosshair and time but leave the interval free, and you can read the same moment across M15, H1, and H4 at once.
Drawing tools
The toolbar down the left edge holds the drawing tools. Radar 61 ships more than thirty, grouped into families. Where a tool has variants, a small arrow appears on hover; click it to pick a different tool from that family.
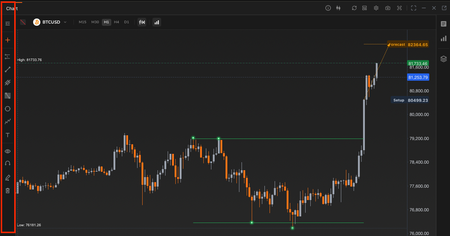 The drawing toolbar.
The families include:
- Position tools. Long Position and Short Position, for marking entry, stop loss, and take profit and reading the risk to reward.
- Lines and channels. Trend lines, rays, and parallel channels.
- Fibonacci. Retracements, trend extensions, spirals, Gann boxes, and velocity fans.
- Harmonics and waves. XABCD patterns and Elliott Wave sequences.
- Shapes and text. Rectangles, ellipses, and text annotations.
Below the tools are controls to show or hide your drawings, snap them to price with magnet mode, and delete them. A star at the foot of the toolbar holds your favourite tools.
The side panel
Three buttons on the right edge of the widget open panels alongside the chart.
The side panel buttons.
- Watchlist. Your saved instruments, with sparklines and daily movement. Holds 5 instruments on Watch, 25 on Core, and an unlimited number on Pro.
- Live Forecast. Forecasts for the instrument you are charting.
- Data Window. Price and indicator values at the crosshair position.
Price scale controls
Four small buttons sit at the bottom right of each panel.
| Button | What it does |
|---|---|
| A | Fits the price scale to the visible data |
| L | Switches to a logarithmic scale |
| % | Switches to a percentage scale |
| Gear | Opens chart settings |
Widget toolbar
Along the top of the widget:
- Info. A short description and a Learn more link to this page.
- Refresh. Reloads price data.
- Layout. Opens the Chart Layout panel.
- Settings. Chart appearance, including candle style and colours.
- Camera. Captures the chart as an image.
- Fullscreen.
- Expand to full width, Minimise, Close, and Pop out.
Reading the status bar
The bar along the bottom of the workspace applies to everything, but it matters most on the Chart.
- A pulsing dot and the trading session, for example "Crypto (Open 24/7)".
- Data is delayed. Prices on the chart are not live tick data.
- The current time and a timezone selector. Changing the timezone here affects how timestamps are shown across the platform.
Important notes
Price data is delayed. Do not treat the chart as a live execution feed.
The Chart is desktop only. Radar 61 shows a desktop only message on small screens, and the chart in particular needs the width.
Related
- Live Forecasts widget. The full feed of detected setups.
- Forecast Analysis. A focused chart for a single forecast, with its levels marked.
- Catalogue widget. The pattern shapes drawn on the chart are documented there.