
Market Clocks Widget
Market Clocks shows which trading sessions are open, which are closed, and how long you have before that changes. Liquidity and volatility follow the sessions, so knowing where you are in the day matters as much as knowing the price.
Adding it to a workspace
Click Widget in the top bar and pick Market Clocks, or choose Open Widget Store to add several widgets at once.
Reading a market
Whichever view you use, each market shows the same three things: its local time, whether it is open or closed, and how long until that changes.
An open market shows OPEN with a countdown to the close, written as CLS and the time remaining. A closed market shows CLOSED, with OPN and a countdown when the next open is known.
Three views
The view button in the widget header cycles through analog, overlap, and digital. The tooltip tells you which one you will get next.
Analog
Traditional clock faces, one per market.
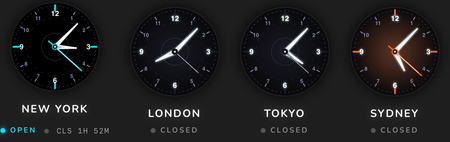 Analog view.
Digital
The same information as digits, with the day and date beneath. The ring around each clock fills as the minute passes, so it is a seconds indicator rather than session progress.
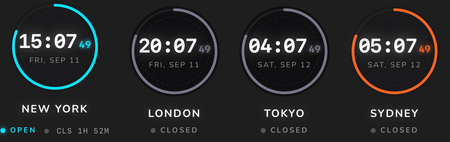 Digital view.
Overlap
A timeline running midnight to midnight, with a bar for each market showing when its session runs. A line marks the current time and is labelled with it.
 Overlap view.
This is the view that earns its name. Where two bars cover the same part of the timeline, two sessions are trading at once, and those overlaps are typically the most active periods of the day. The London and New York overlap is the obvious one to watch. When two or more sessions are open at the same time, a pulsing indicator appears at the foot of the timeline. It is worth noticing: overlapping sessions usually mean higher volume and sharper moves, so a setup behaves differently during an overlap than it does in a quiet single session.
Choosing markets
The gear icon opens the settings panel.
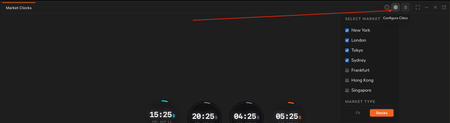 Market selection and market type.
Select markets covers New York, London, Tokyo, Sydney, Frankfurt, Hong Kong, and Singapore. Four are selected by default; tick the others if you trade them.
Market type switches between FX and Stocks. This matters more than it looks: currency markets and stock exchanges in the same city keep different hours, so the session bars and countdowns change when you switch. Set it to match what you actually trade.
Colour
Three separate things are colour coded, and they mean different things.
Time of day
The glow behind each analog clock, and the ring in digital view, follow the local time at that market.
| Local time | Glow |
|---|---|
| 5:00am to 8:59am | Sunrise, orange |
| 9:00am to 3:59pm | Day, cyan |
| 4:00pm to 6:59pm | Sunset, purple |
| 7:00pm to 4:59am | Night, dark blue |
A market can glow warm while still being closed, and the daytime glow is the same cyan used for the open indicator. Whether a market is trading is shown only by the dot and the word beside the city name.
Open or closed
The dot and label beneath each city show whether it is trading.
| Colour | Meaning |
|---|---|
| Cyan | Open |
| Grey | Closed |
Overlap view
Orange marks anything currently active: the session bars of markets that are open, and the line showing the present moment on the timeline.
Important notes
Times shown are each market's local time, not yours. The overlap view labels them explicitly as local.
Sessions do not run at weekends. A market showing a long countdown on a Saturday is counting to the next weekday open.
Related
- Economic Calendar widget. Scheduled releases, which land during specific sessions.
- Live Forecasts widget. Forecasts arrive around the clock, but which session is open affects how price behaves.