
Layouts and sync
Split one chart widget into as many as 16 panes, and decide which panes share their instrument, timeframe, crosshair and scroll.
A single Chart widget can hold several panes, each with its own instrument and timeframe. Use them to watch several markets at once, or one market on several timeframes.
Choosing a layout
Click Layout in the chart toolbar.
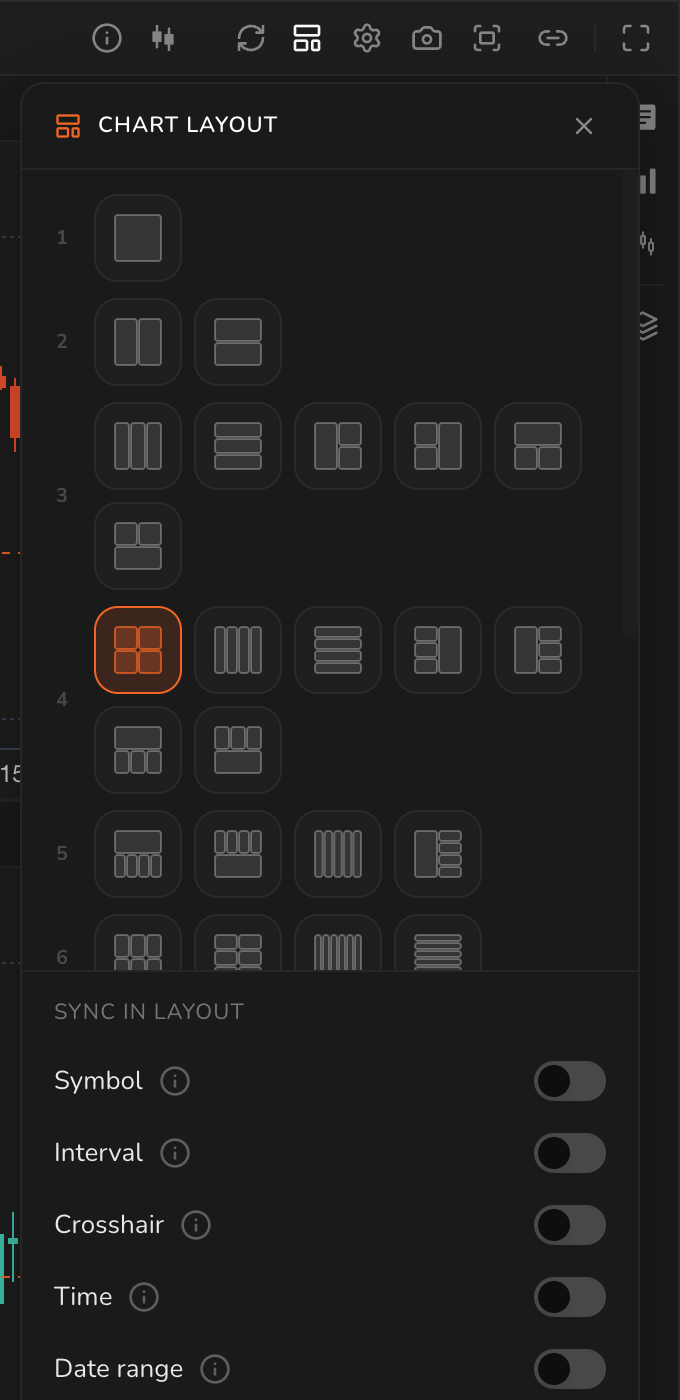
Pick a layout: Single, Side by Side, Stacked, three columns or rows, large left, right, top or bottom, a 2×2 grid, four columns or rows, and grids up to 4×4.
Sync in Layout controls what panes share:
| Option | What it does |
|---|---|
| Symbol | Every pane shows the same instrument |
| Interval | Every pane uses the same timeframe |
| Crosshair | The crosshair moves on every pane together |
| Time | Scrolling one pane scrolls them all |
| Date range | Zooming one pane zooms them all |
Turning on Symbol or Interval copies the active pane's value to every pane.
Working with panes
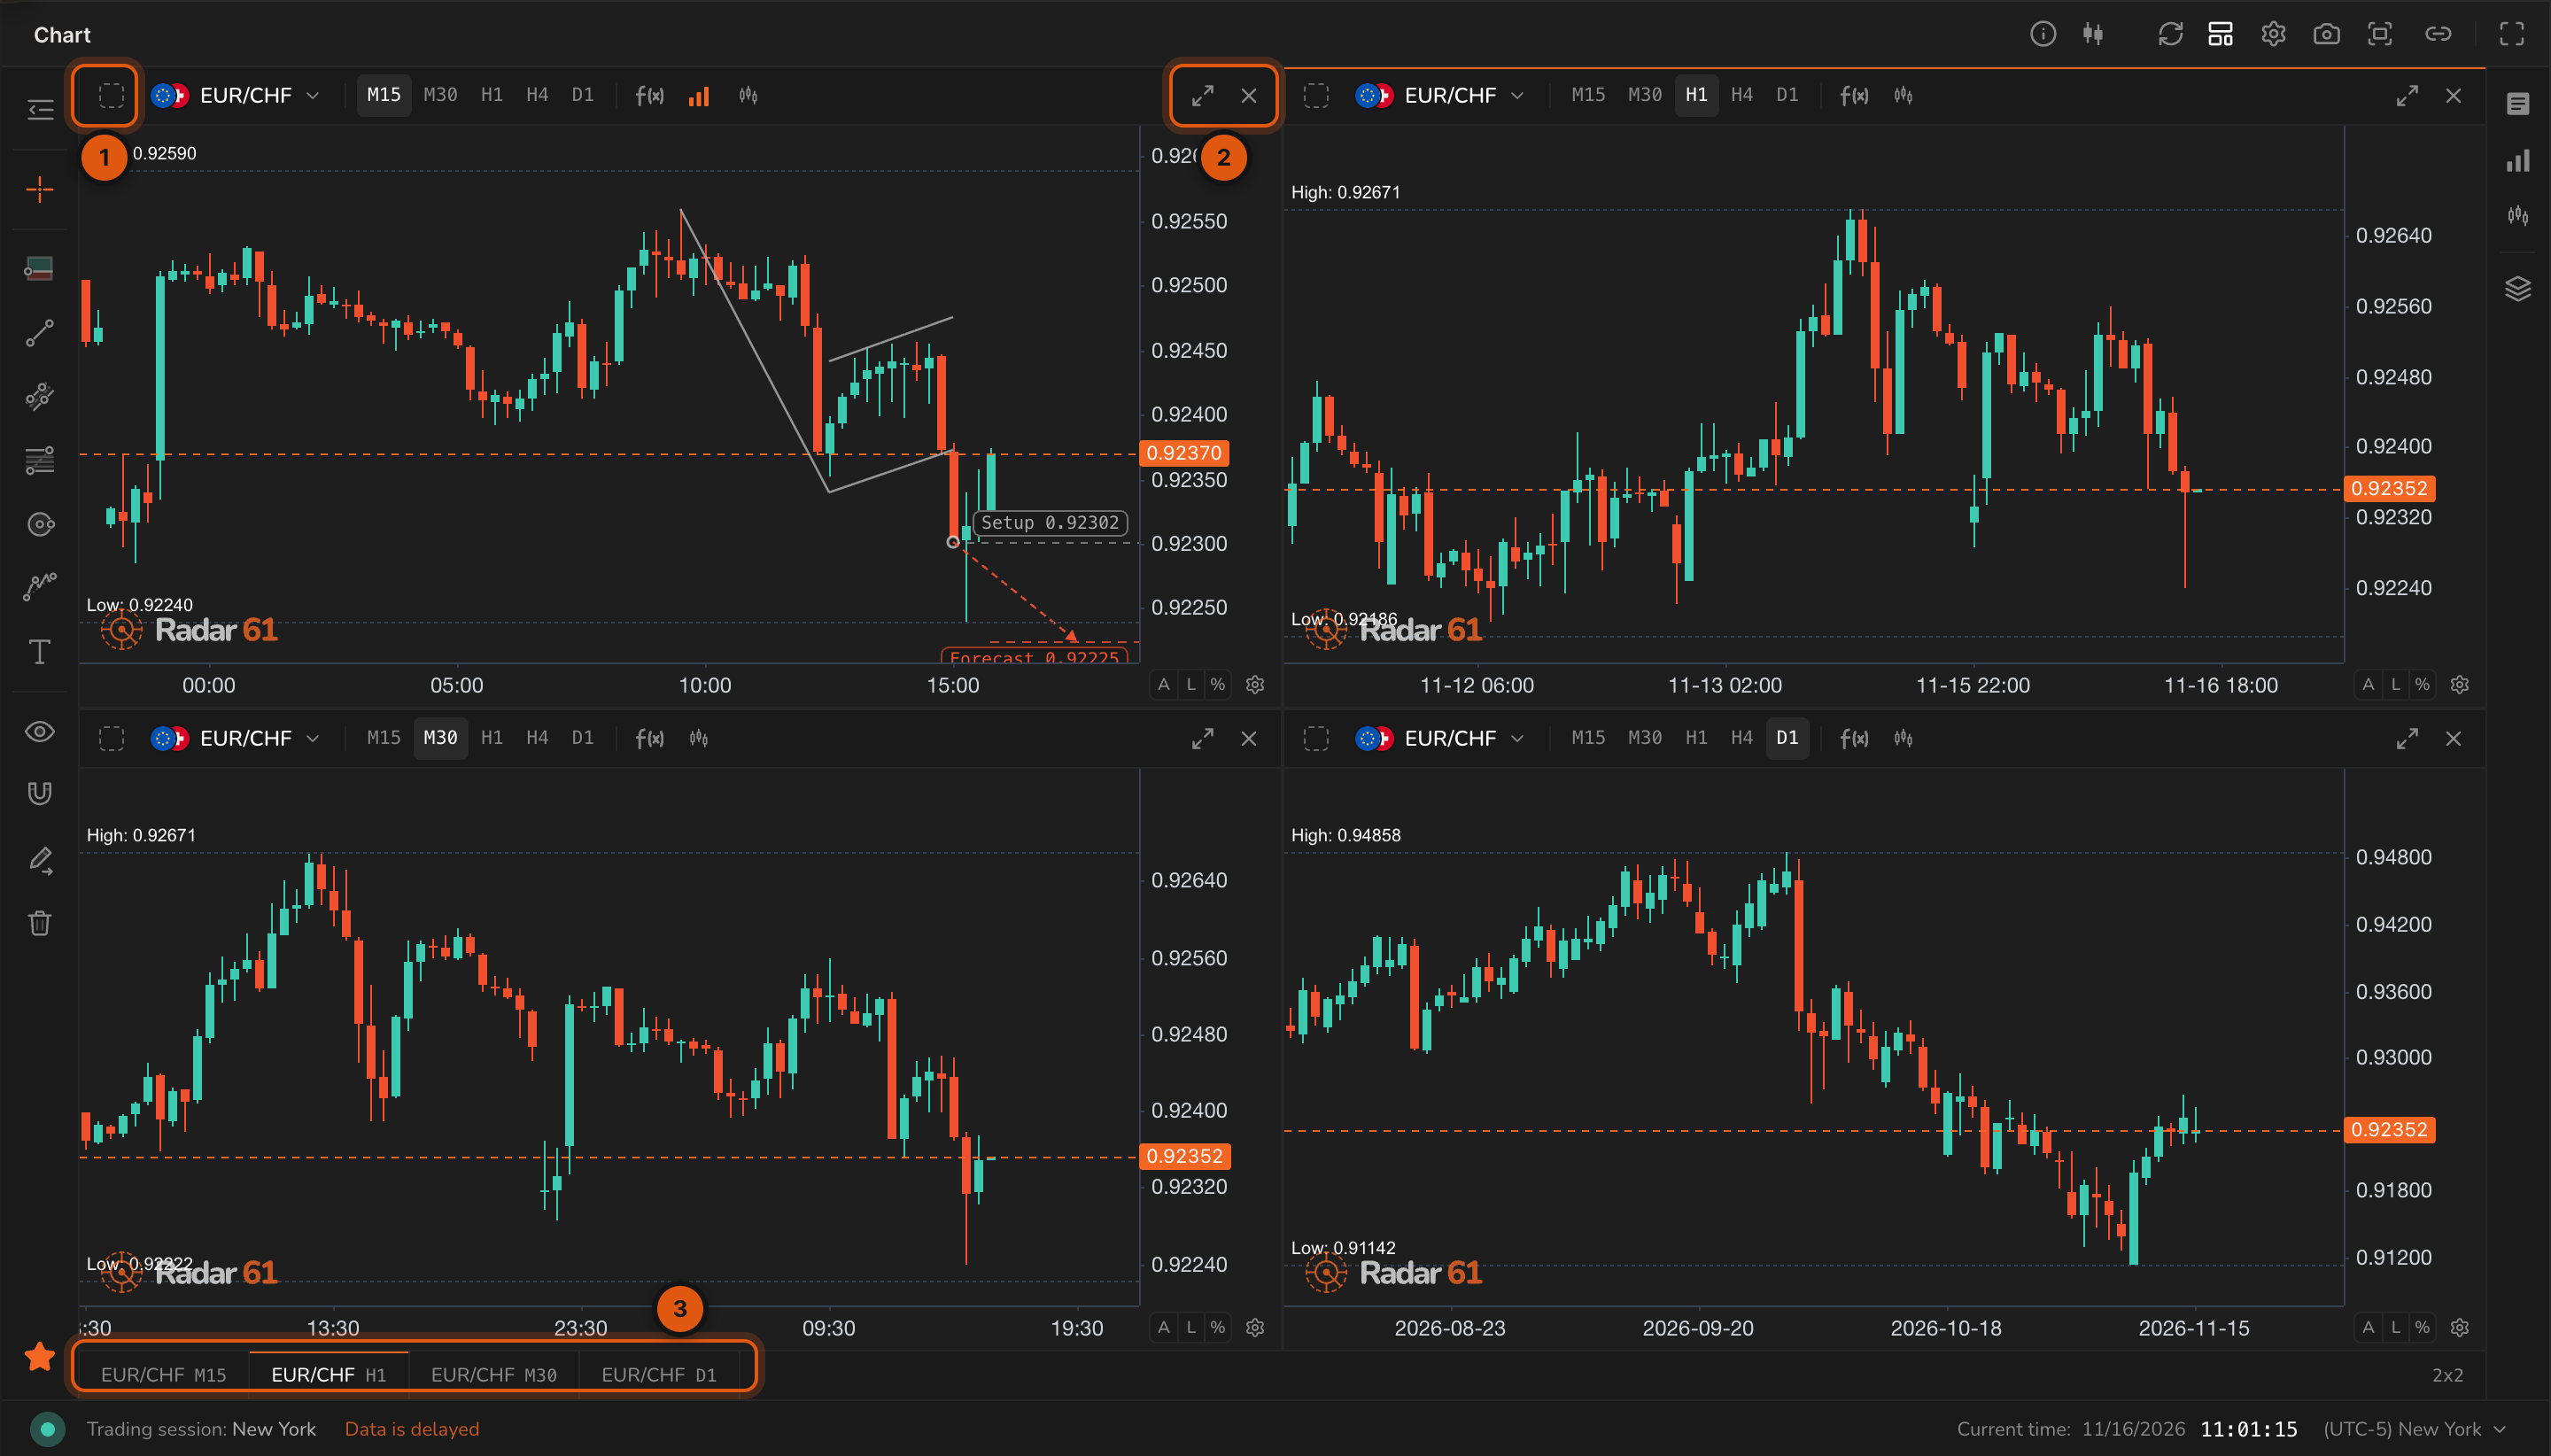
- Sync group: the letter that links this pane with others.
- Maximise pane and Close pane.
- Pane tabs: jump between panes, and see the layout name.
The active pane has a highlighted border. The toolbar, indicators and drawing tools act on the active pane.
Sync groups
Sync groups link some panes and not others. Click the square at the left of a pane header and pick a letter from A to H. Panes on the same letter change instrument together. Not synced takes the pane out of every group.
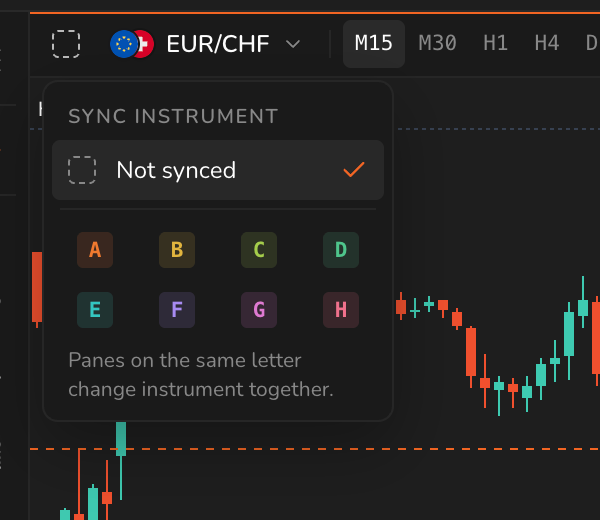
For example, put two EURUSD panes on A and two GBPUSD panes on B, then change one pane on A: only the other A pane follows.
Linking widgets
Sync groups work inside one chart widget. To make the chart follow other widgets, such as News Events or the Watchlist, use Link widget in the chart toolbar.