Technical Analysis
A library of 184 patterns, from single candles to Elliott waves and Smart Money Concepts, found live on your chart, scored, and explained rule by rule.
Technical Analysis reads the chart you're looking at and marks every pattern it finds: candlesticks, chart patterns, harmonics, price action, Elliott waves and Smart Money Concepts. Each match is scored, shows the rules it passed, and tells you whether it's still live.
It's separate from the forecast engine. Forecasts are published for everyone. Technical Analysis runs on your chart, on the instrument and timeframe you choose, with settings you control.
Turning it on
Click the Technical Analysis button in the pane header. The Technical Analysis app has it on already, set to chart patterns.
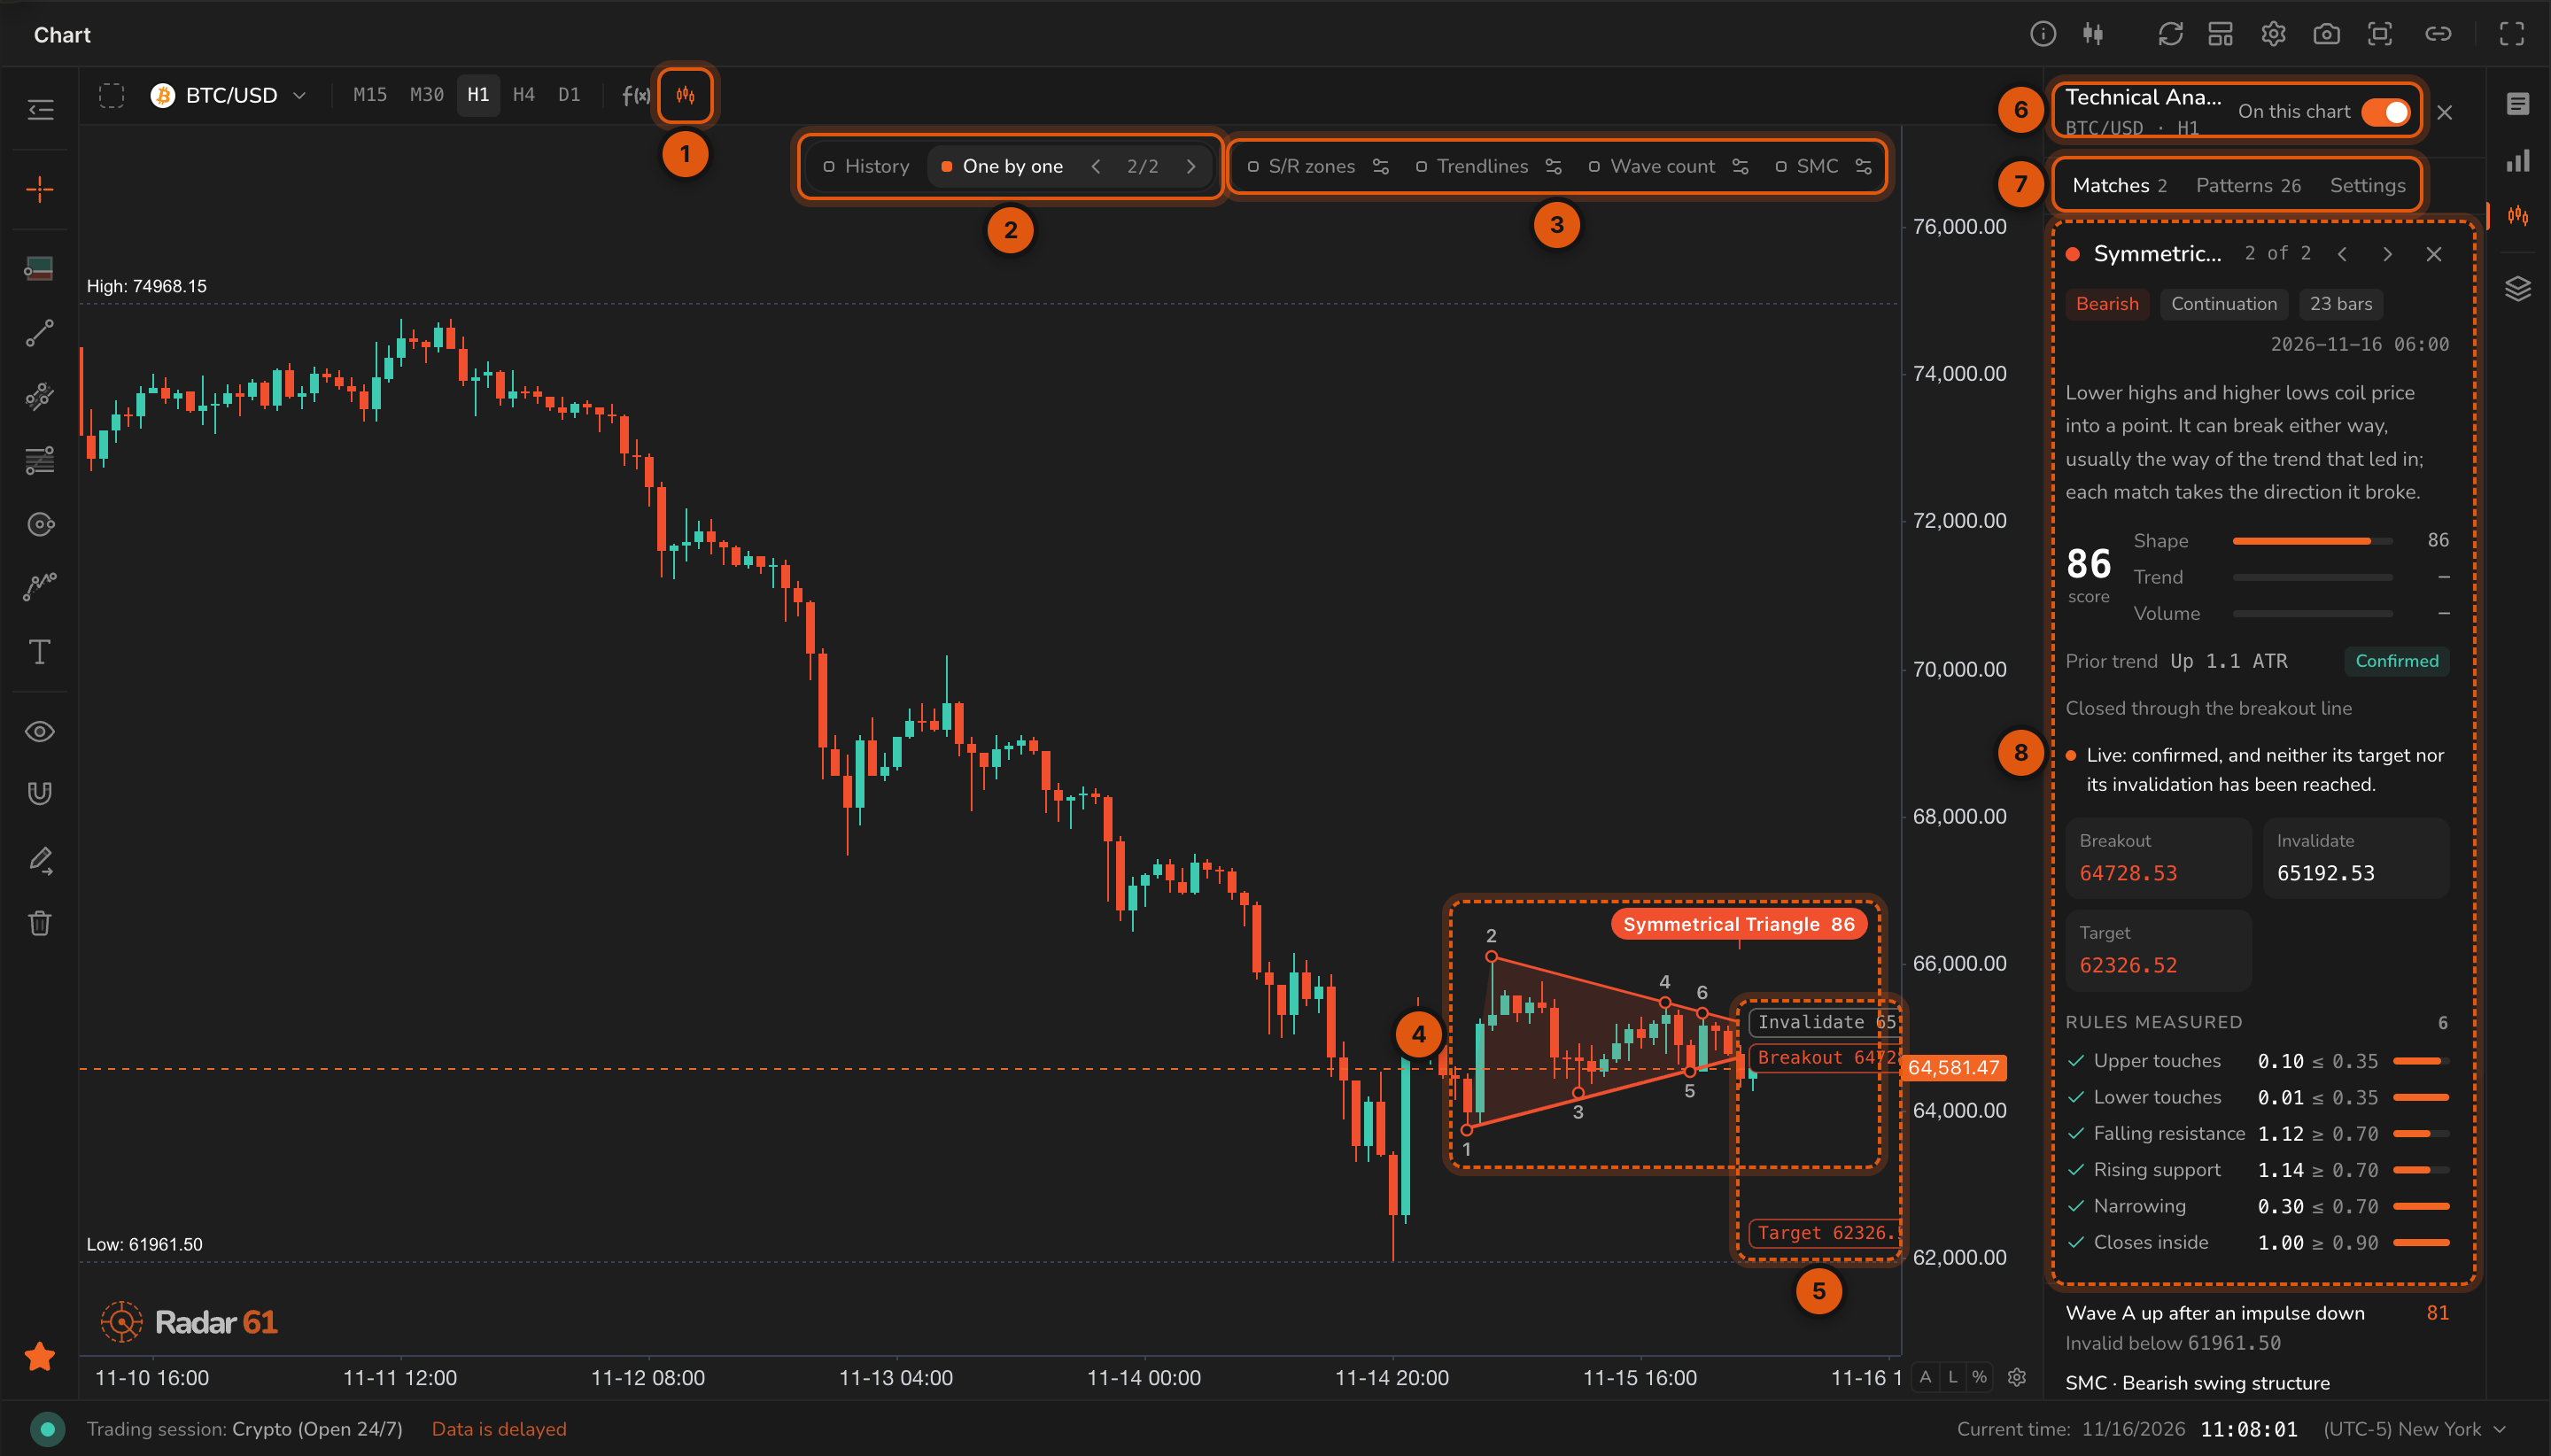
- Technical Analysis on or off for this pane.
- Which matches show: History draws every match in view, including ones that have played out. One by one shows a single match, and the ‹ n/N › stepper moves through them.
- Overlays: S/R zones, Trendlines, Wave count and SMC. Each has an options button.
- The matched pattern, drawn on the price with its name and score.
- Its levels: breakout, invalidation and target.
- The Technical Analysis panel, with On this chart to show or hide everything at once.
- Matches, Patterns and Settings tabs.
- The selected match. See Reading a match.
Reading a match
The match card explains what was found and why.
- Name and its position in the list, such as 2 of 2.
- Tags: direction, signal type (for example Continuation), and how many bars it spans.
- Time it formed, and a short description of the pattern.
- Score out of 100, split into Shape, Trend and Volume.
- Prior trend: the direction and strength of the move before it, in ATR.
- Confirmed, and a sentence on its status.
- Breakout, Invalidate and Target prices.
- Rules measured: each rule the pattern has to pass, with the measured value against its limit.
Below the card, the wave summary and the SMC summary describe the current wave count and swing structure.
Match status
| Status | Meaning |
|---|---|
| Awaiting | Live: waiting for the close that confirms it |
| In play | Live: confirmed, and neither its target nor its invalidation has been reached |
| Fresh | Live: it formed within the confirmation window |
| Target hit | Played out: price reached its target |
| Invalidated | Played out: a close went back through its invalidation after it confirmed |
| Failed | Played out: it was invalidated before it confirmed |
| Unconfirmed | Played out: no confirming close came within its window |
| Played out | Its window has passed |
The Matches tab
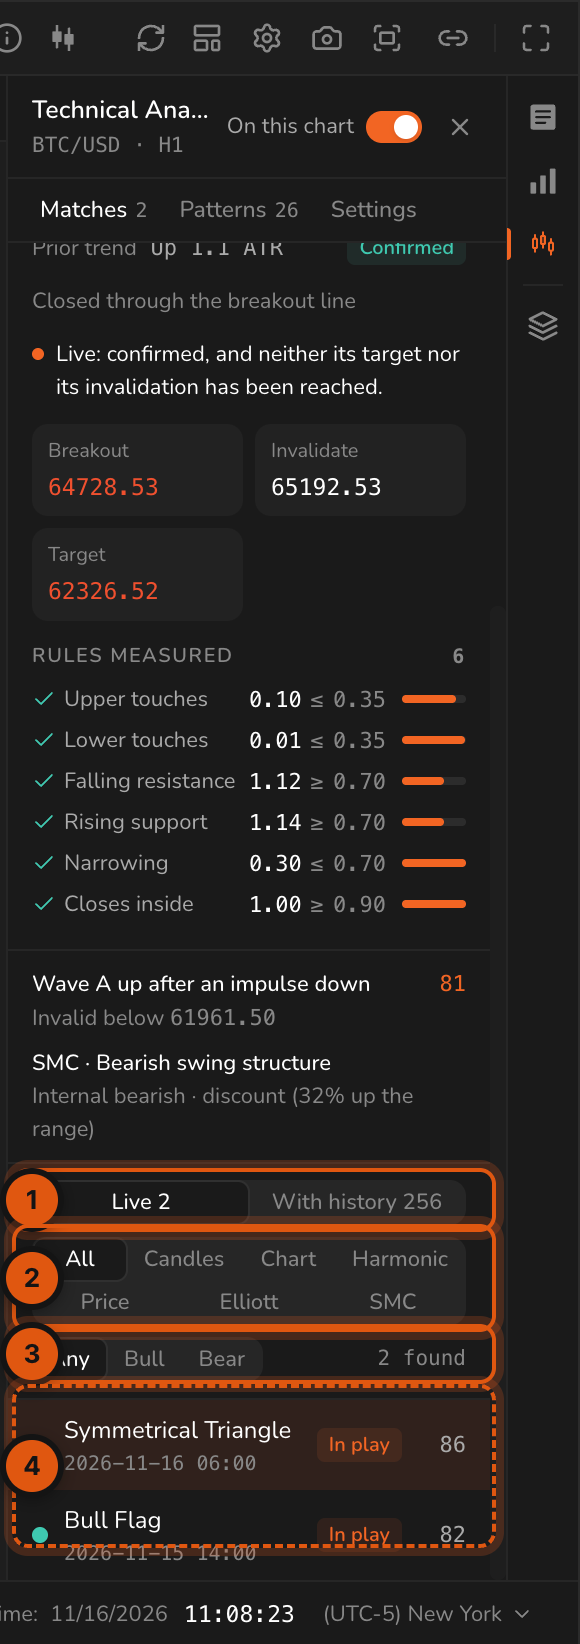
- Live shows matches that are still in play. With history adds the ones that have played out.
- Filter by family: All, Candles, Chart, Harmonic, Price, Elliott, SMC.
- Filter by direction: Any, Bull, Bear.
- Each match, with its score and status. Click one to select it on the chart.
The Patterns tab
Choose which patterns the library looks for.
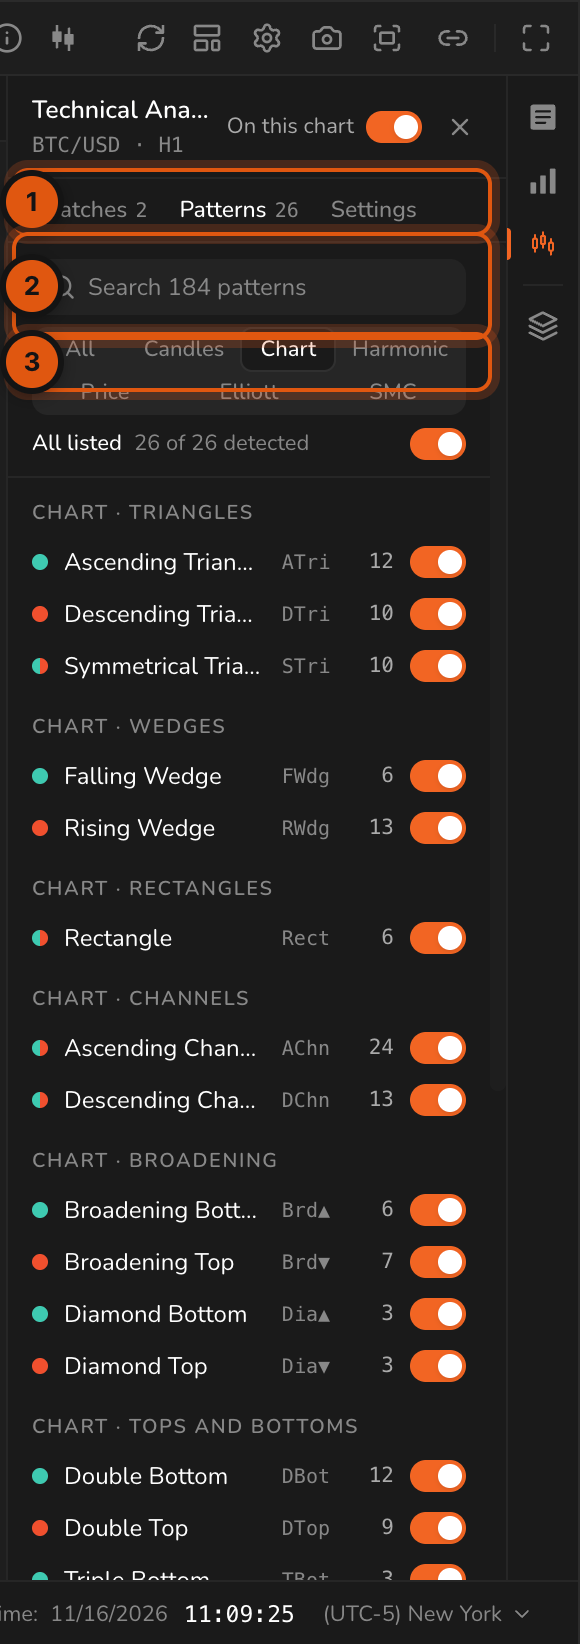
- Search all 184 patterns.
- Filter by family.
- All patterns turns every pattern in view on or off, and shows how many are detected.
Each pattern has its own switch and shows how many times it's been found on this chart.
| Family | Patterns |
|---|---|
| Candlestick | 78 |
| Chart | 26 |
| Harmonic | 22 |
| Elliott | 22 |
| Smart Money Concepts | 24 |
| Price action | 12 |
The Settings tab
Fine-tune detection for each family.
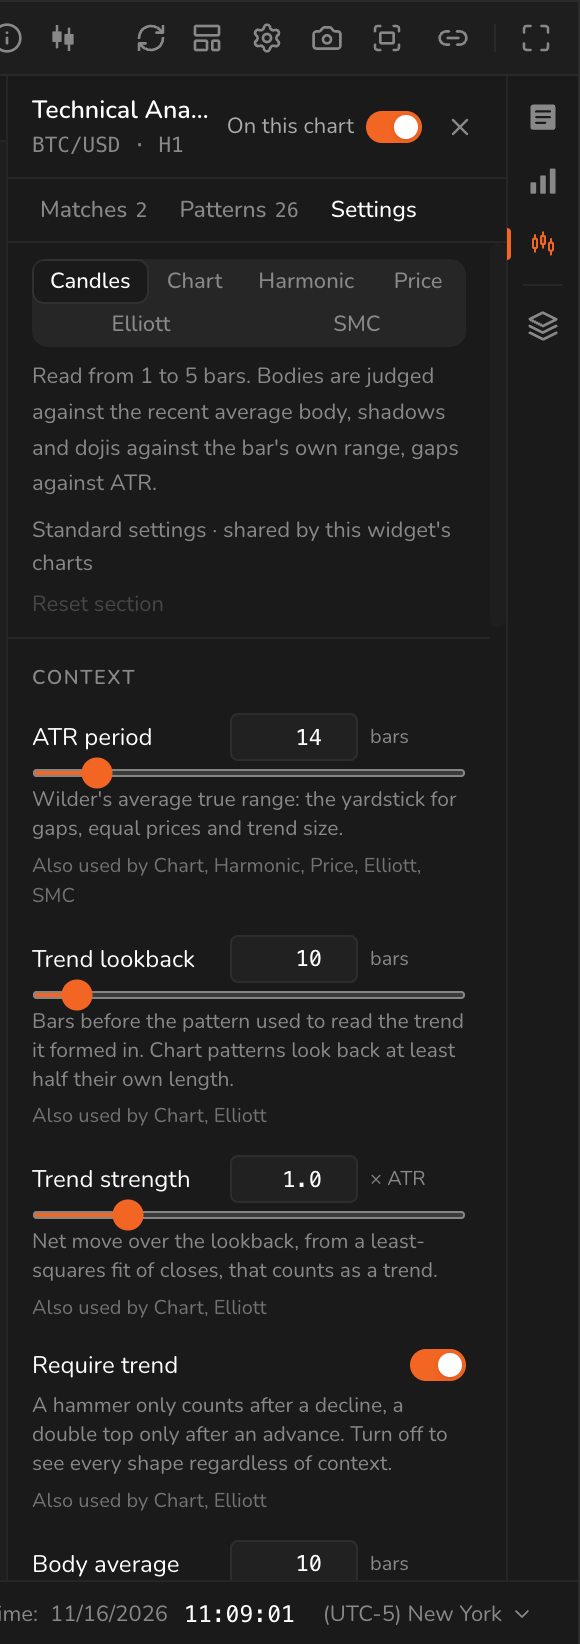
Pick a family at the top. Each slider explains what it does and which families use it. Standard settings are shared by every chart in the widget. Reset section restores the defaults.
Common settings:
| Setting | What it does |
|---|---|
| ATR period | The average true range used as the yardstick for gaps, equal prices and trend size |
| Trend lookback | How many bars before the pattern are used to read the trend it formed in |
| Trend strength | How far price must move over the lookback, in ATR, to count as a trend |
| Require trend | Only count a pattern after the trend it needs, such as a hammer after a decline |
| Body average | How many bars set the average candle body |
| Shape, trend and volume weight | How much each part counts toward the score |
Overlays
Overlays add context to the chart around the matches.
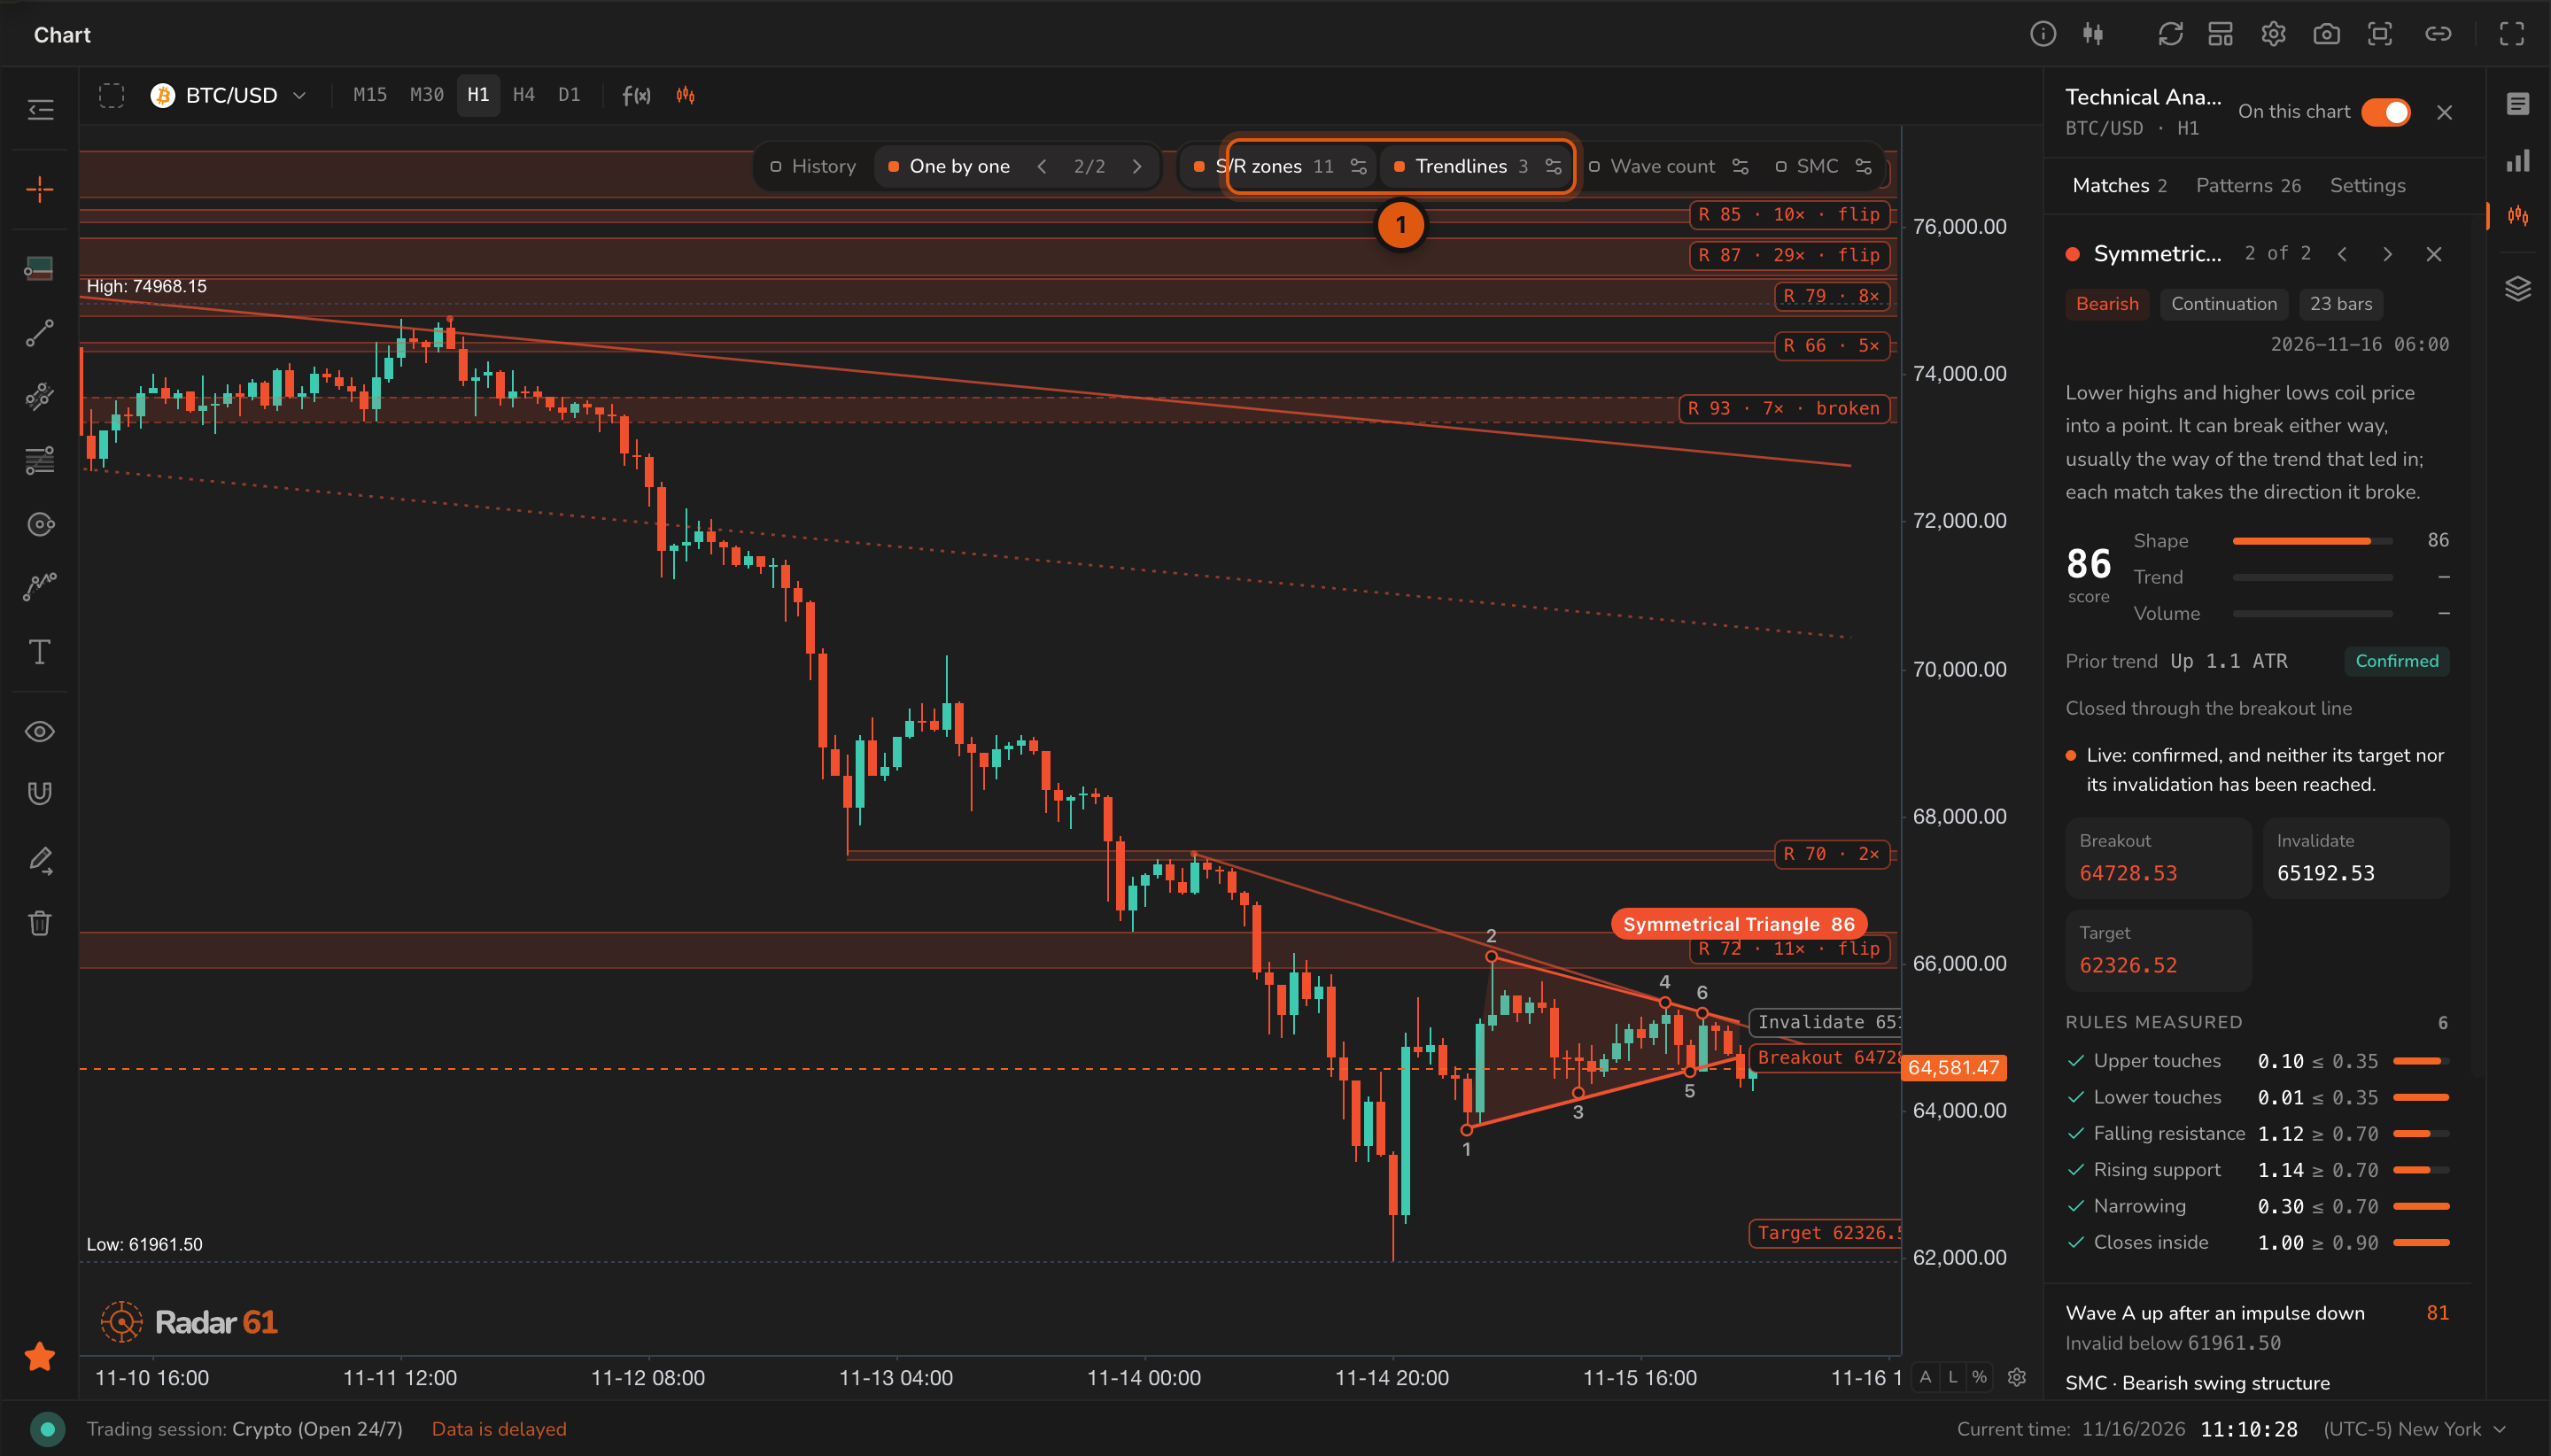
- S/R zones and Trendlines turned on.
- S/R zones marks support and resistance, with how many times each was touched and whether it flipped or broke.
- Trendlines draws the strongest lines through swing highs and lows.
- Wave count labels the Elliott wave structure.
- SMC marks breaks of structure, changes of character, order blocks and fair value gaps.
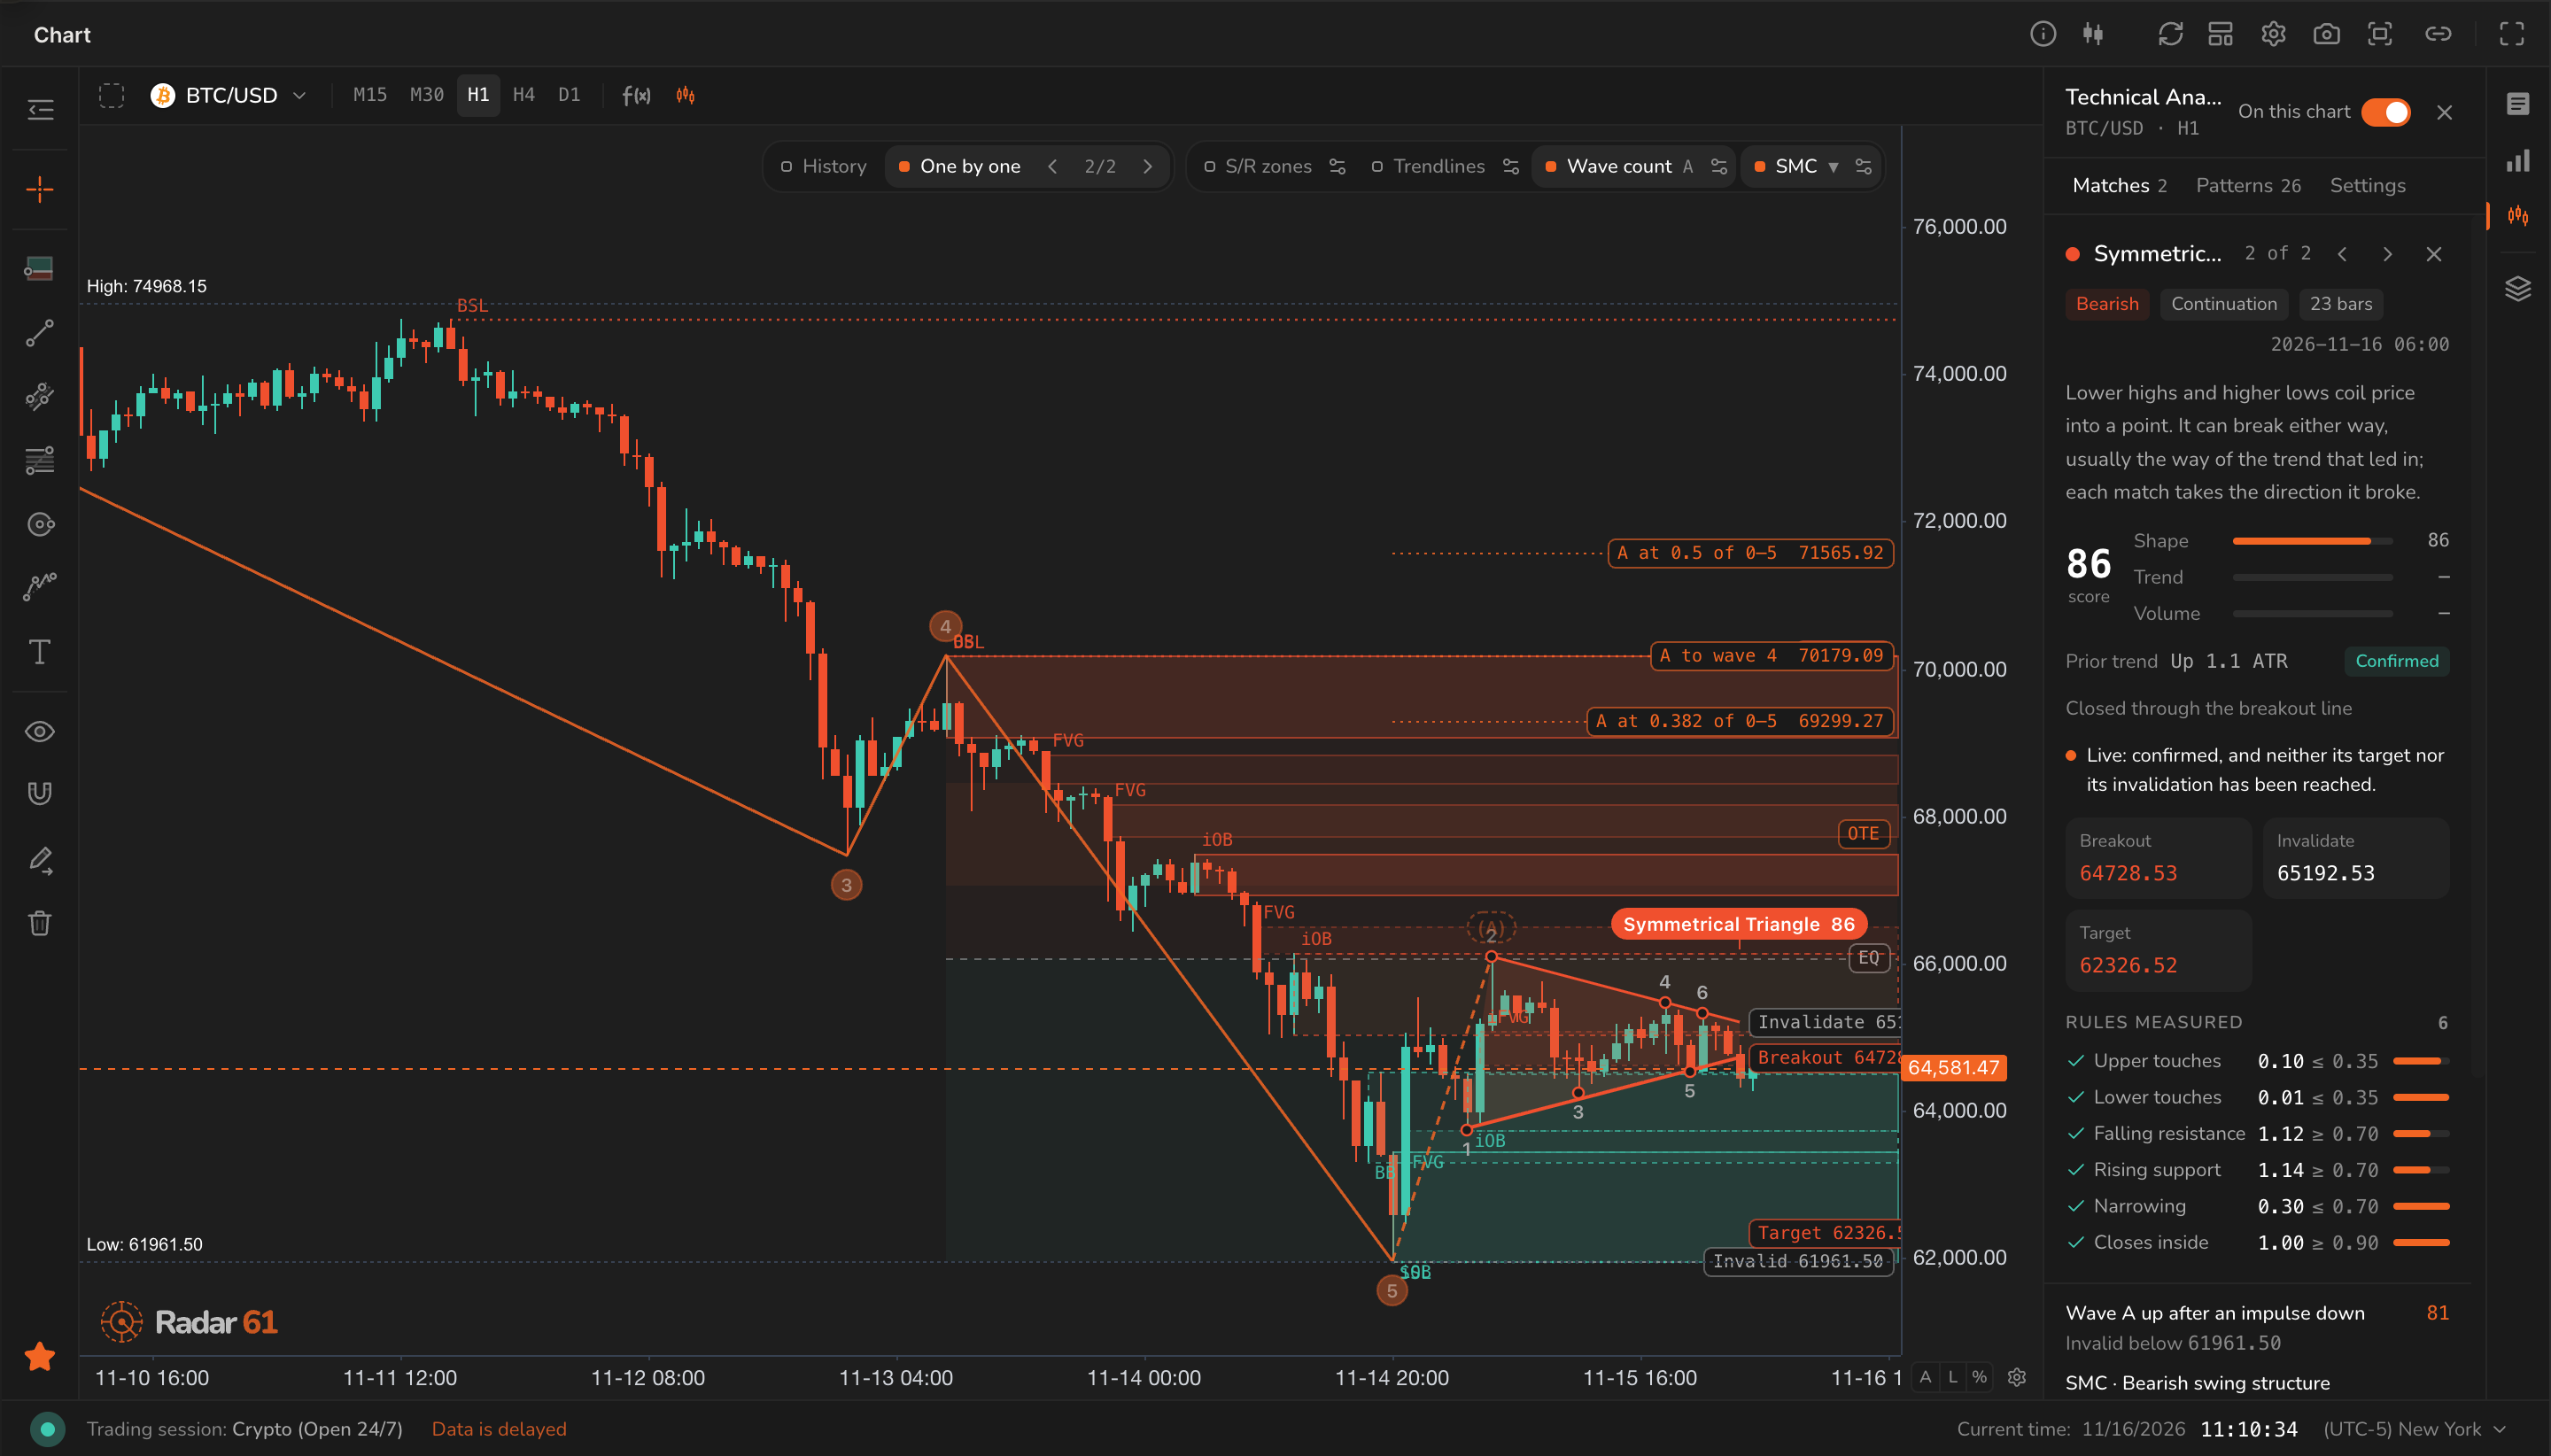
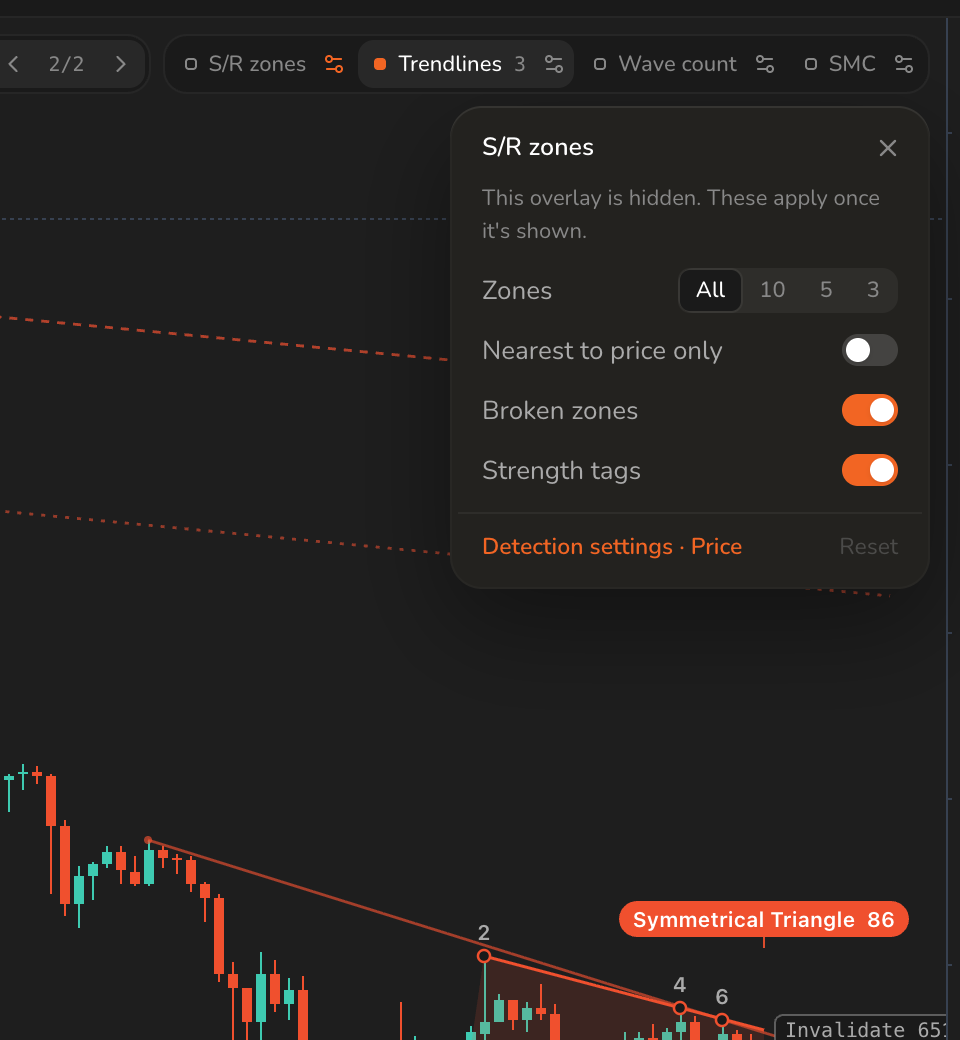
Click the options button on an overlay to adjust it. For S/R zones: how many zones (All, 10, 5 or 3), Nearest to price only, Broken zones, Strength tags, and a link to the detection settings.