
Indicators
Add moving averages, oscillators and volume studies to any pane, adjust their settings, and manage them from the legend.
Last updated on Nov 16, 20262 min read
Click f(x) in the pane header to open the indicator browser.
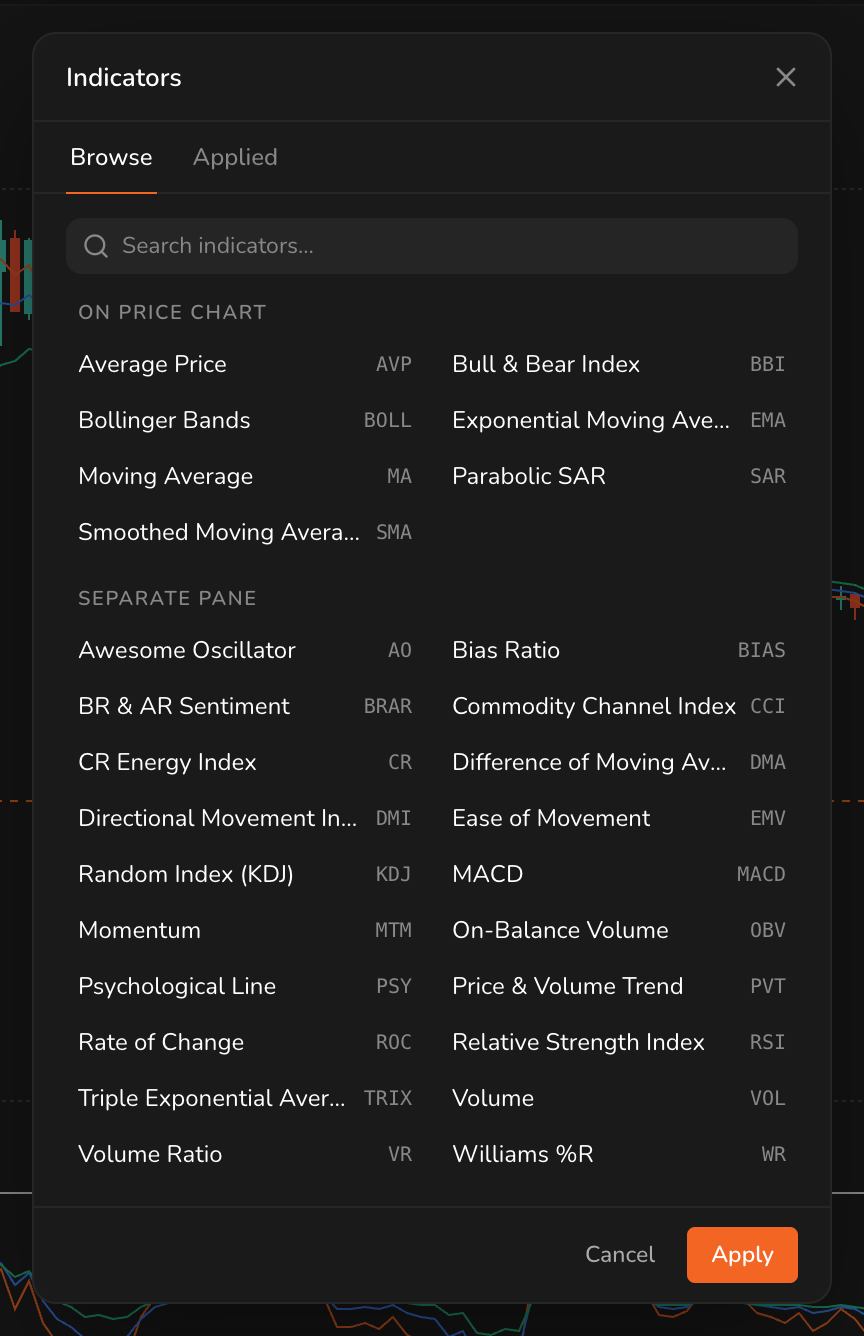
Indicators are grouped by where they draw.
| Where | Indicators |
|---|---|
| On the price chart | AVP, BBI, BOLL, EMA, MA, SAR, SMA |
| In a separate pane | AO, BIAS, BRAR, CCI, CR, DMA, DMI, EMV, KDJ, MACD, MTM, OBV, PSY, PVT, ROC, RSI, TRIX, VOL, VR, WR |
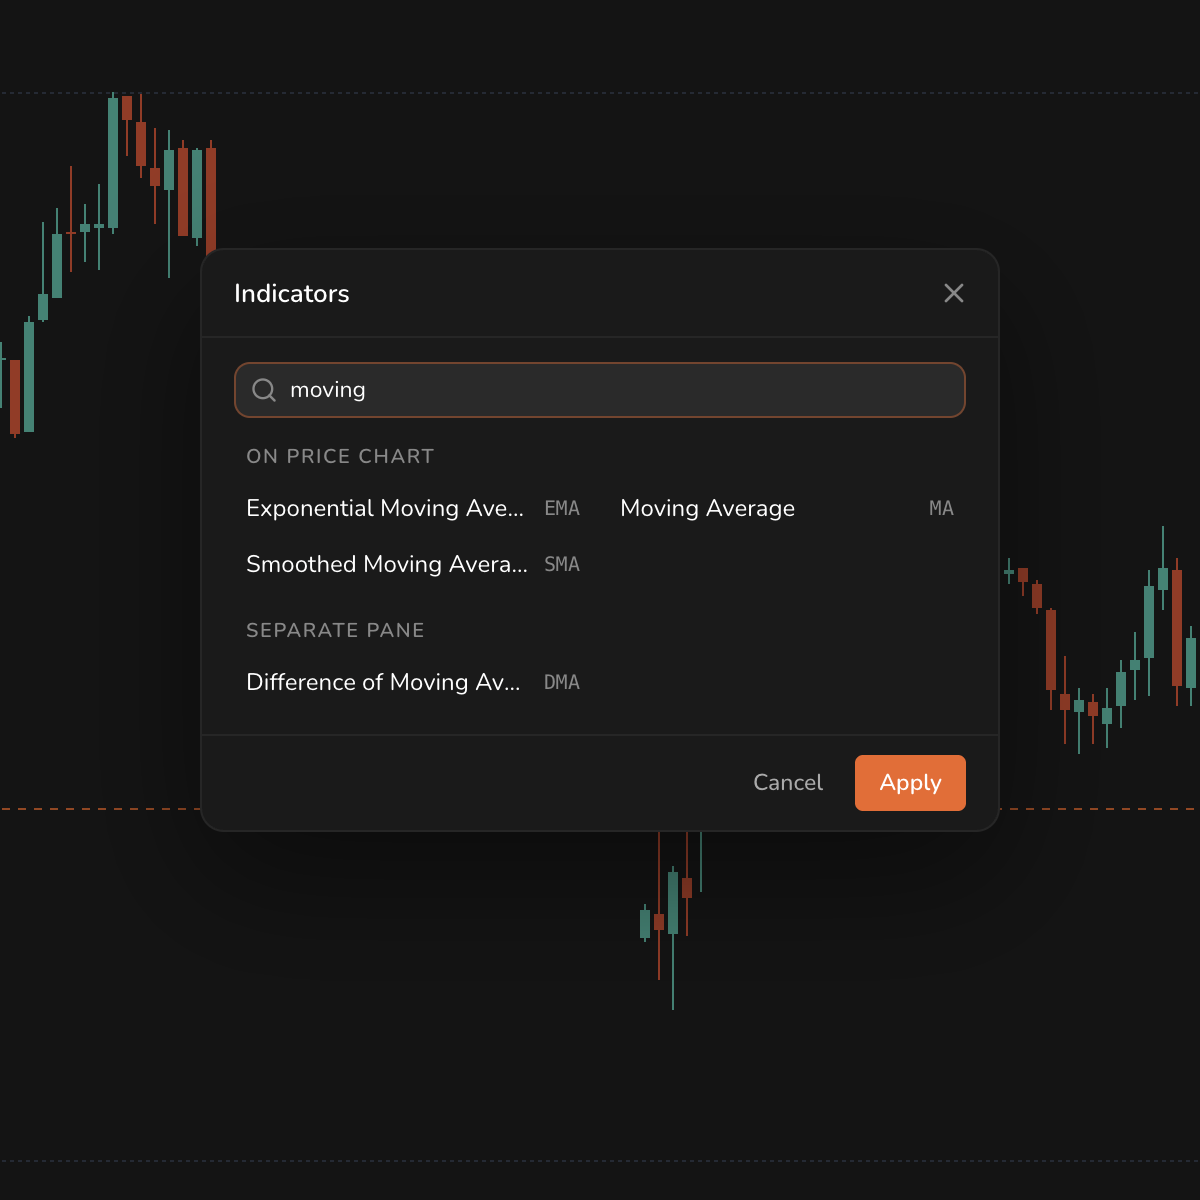
Type in the search box to find one by name.
Applying and managing
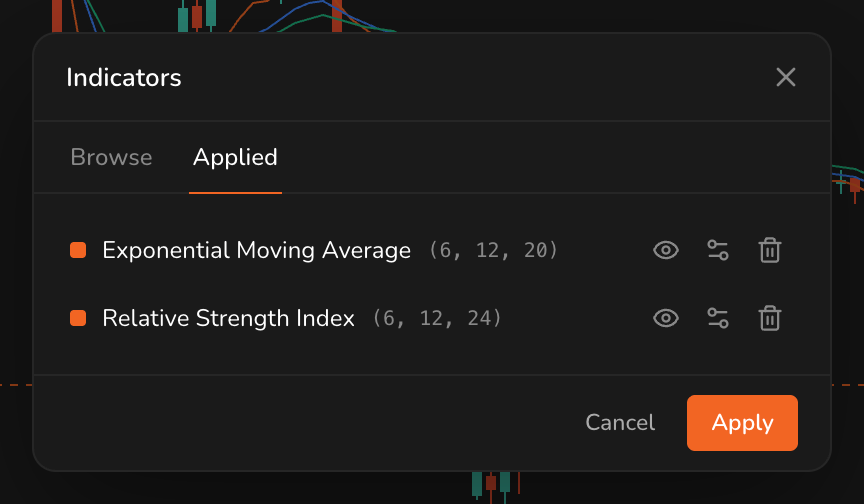
Tick the indicators you want, then click Apply. The Applied tab lists what's on the pane, with buttons to show or hide, open settings, or remove each one.
On the chart
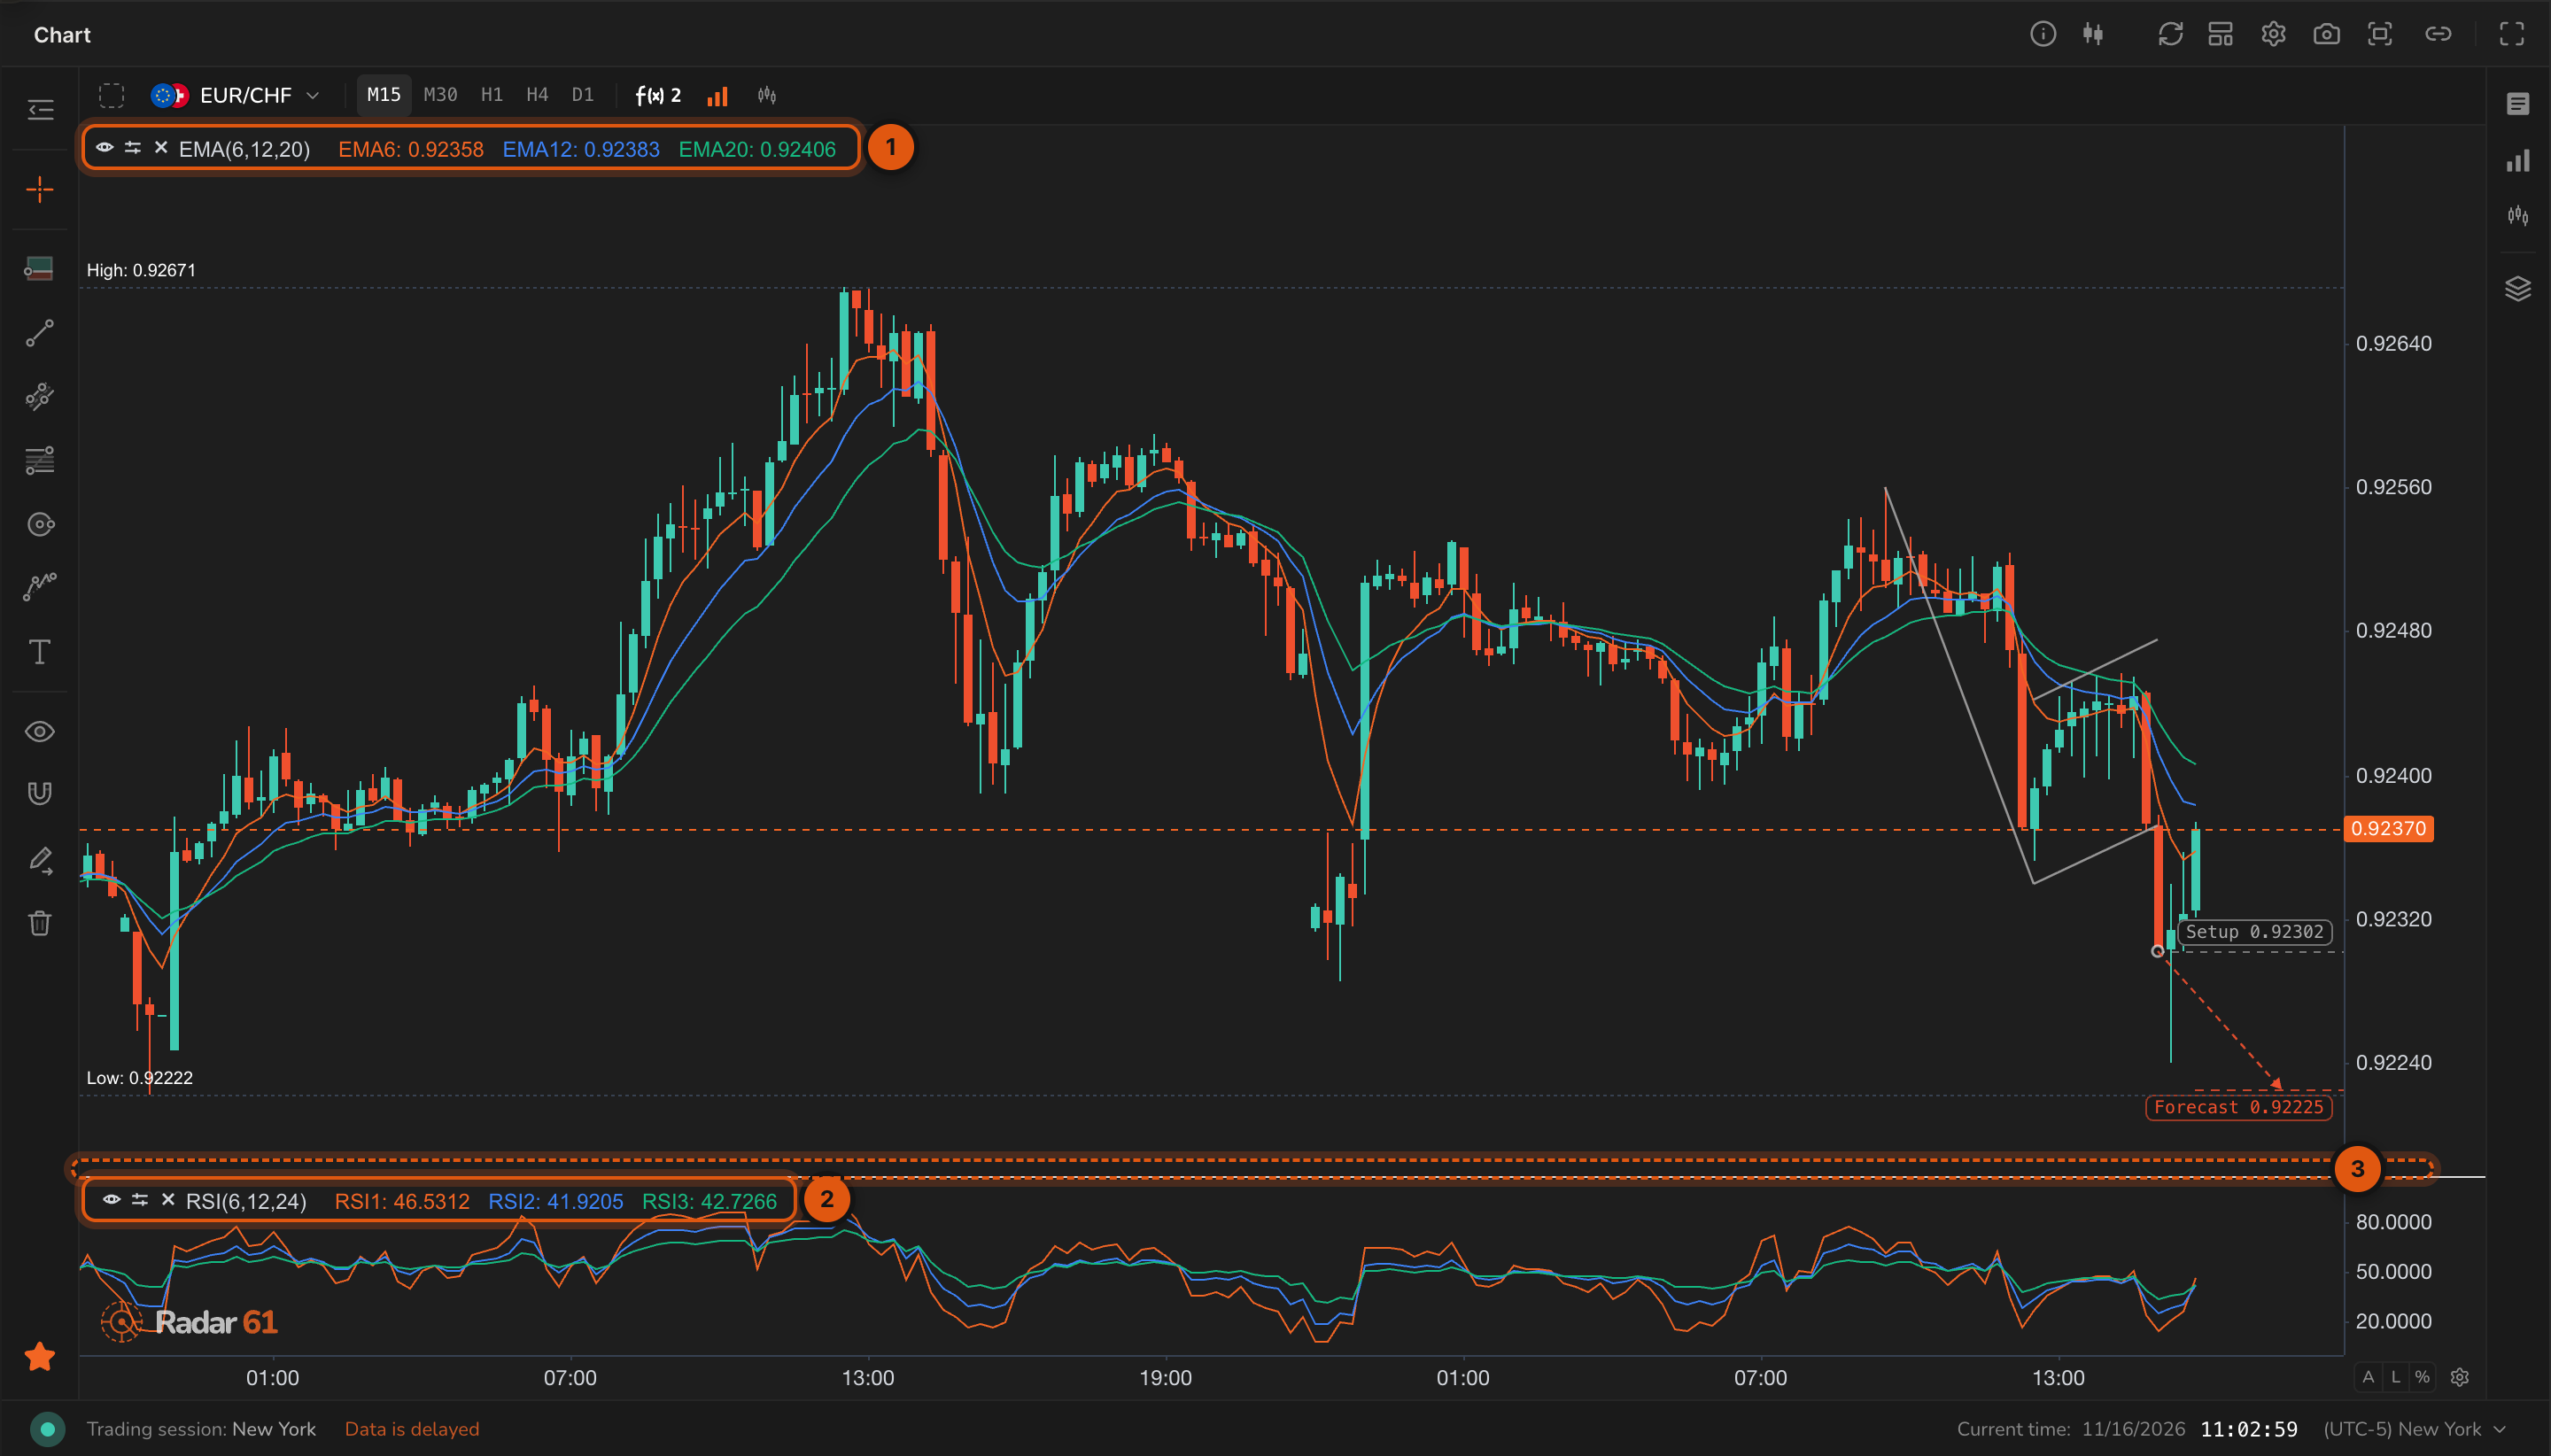
- An indicator drawn on the price, with its legend.
- An indicator in its own pane, with its legend.
- The divider between panes. Drag it to resize.
Point at a legend to show its controls: the eye hides or shows the indicator, the gear opens its settings, and × removes it.
Your plan sets how many indicators a pane can hold. See Plans.