
Dashboard
Your home screen. Today's forecast activity, your watchlist, the latest forecasts, what's coming up, open sessions and the engine's track record, on one page.
Last updated on Nov 16, 20262 min read
The Dashboard is the first screen after sign-in, and it's always one click away from the sidebar or the status bar. It summarises the market and your account without opening a workspace.
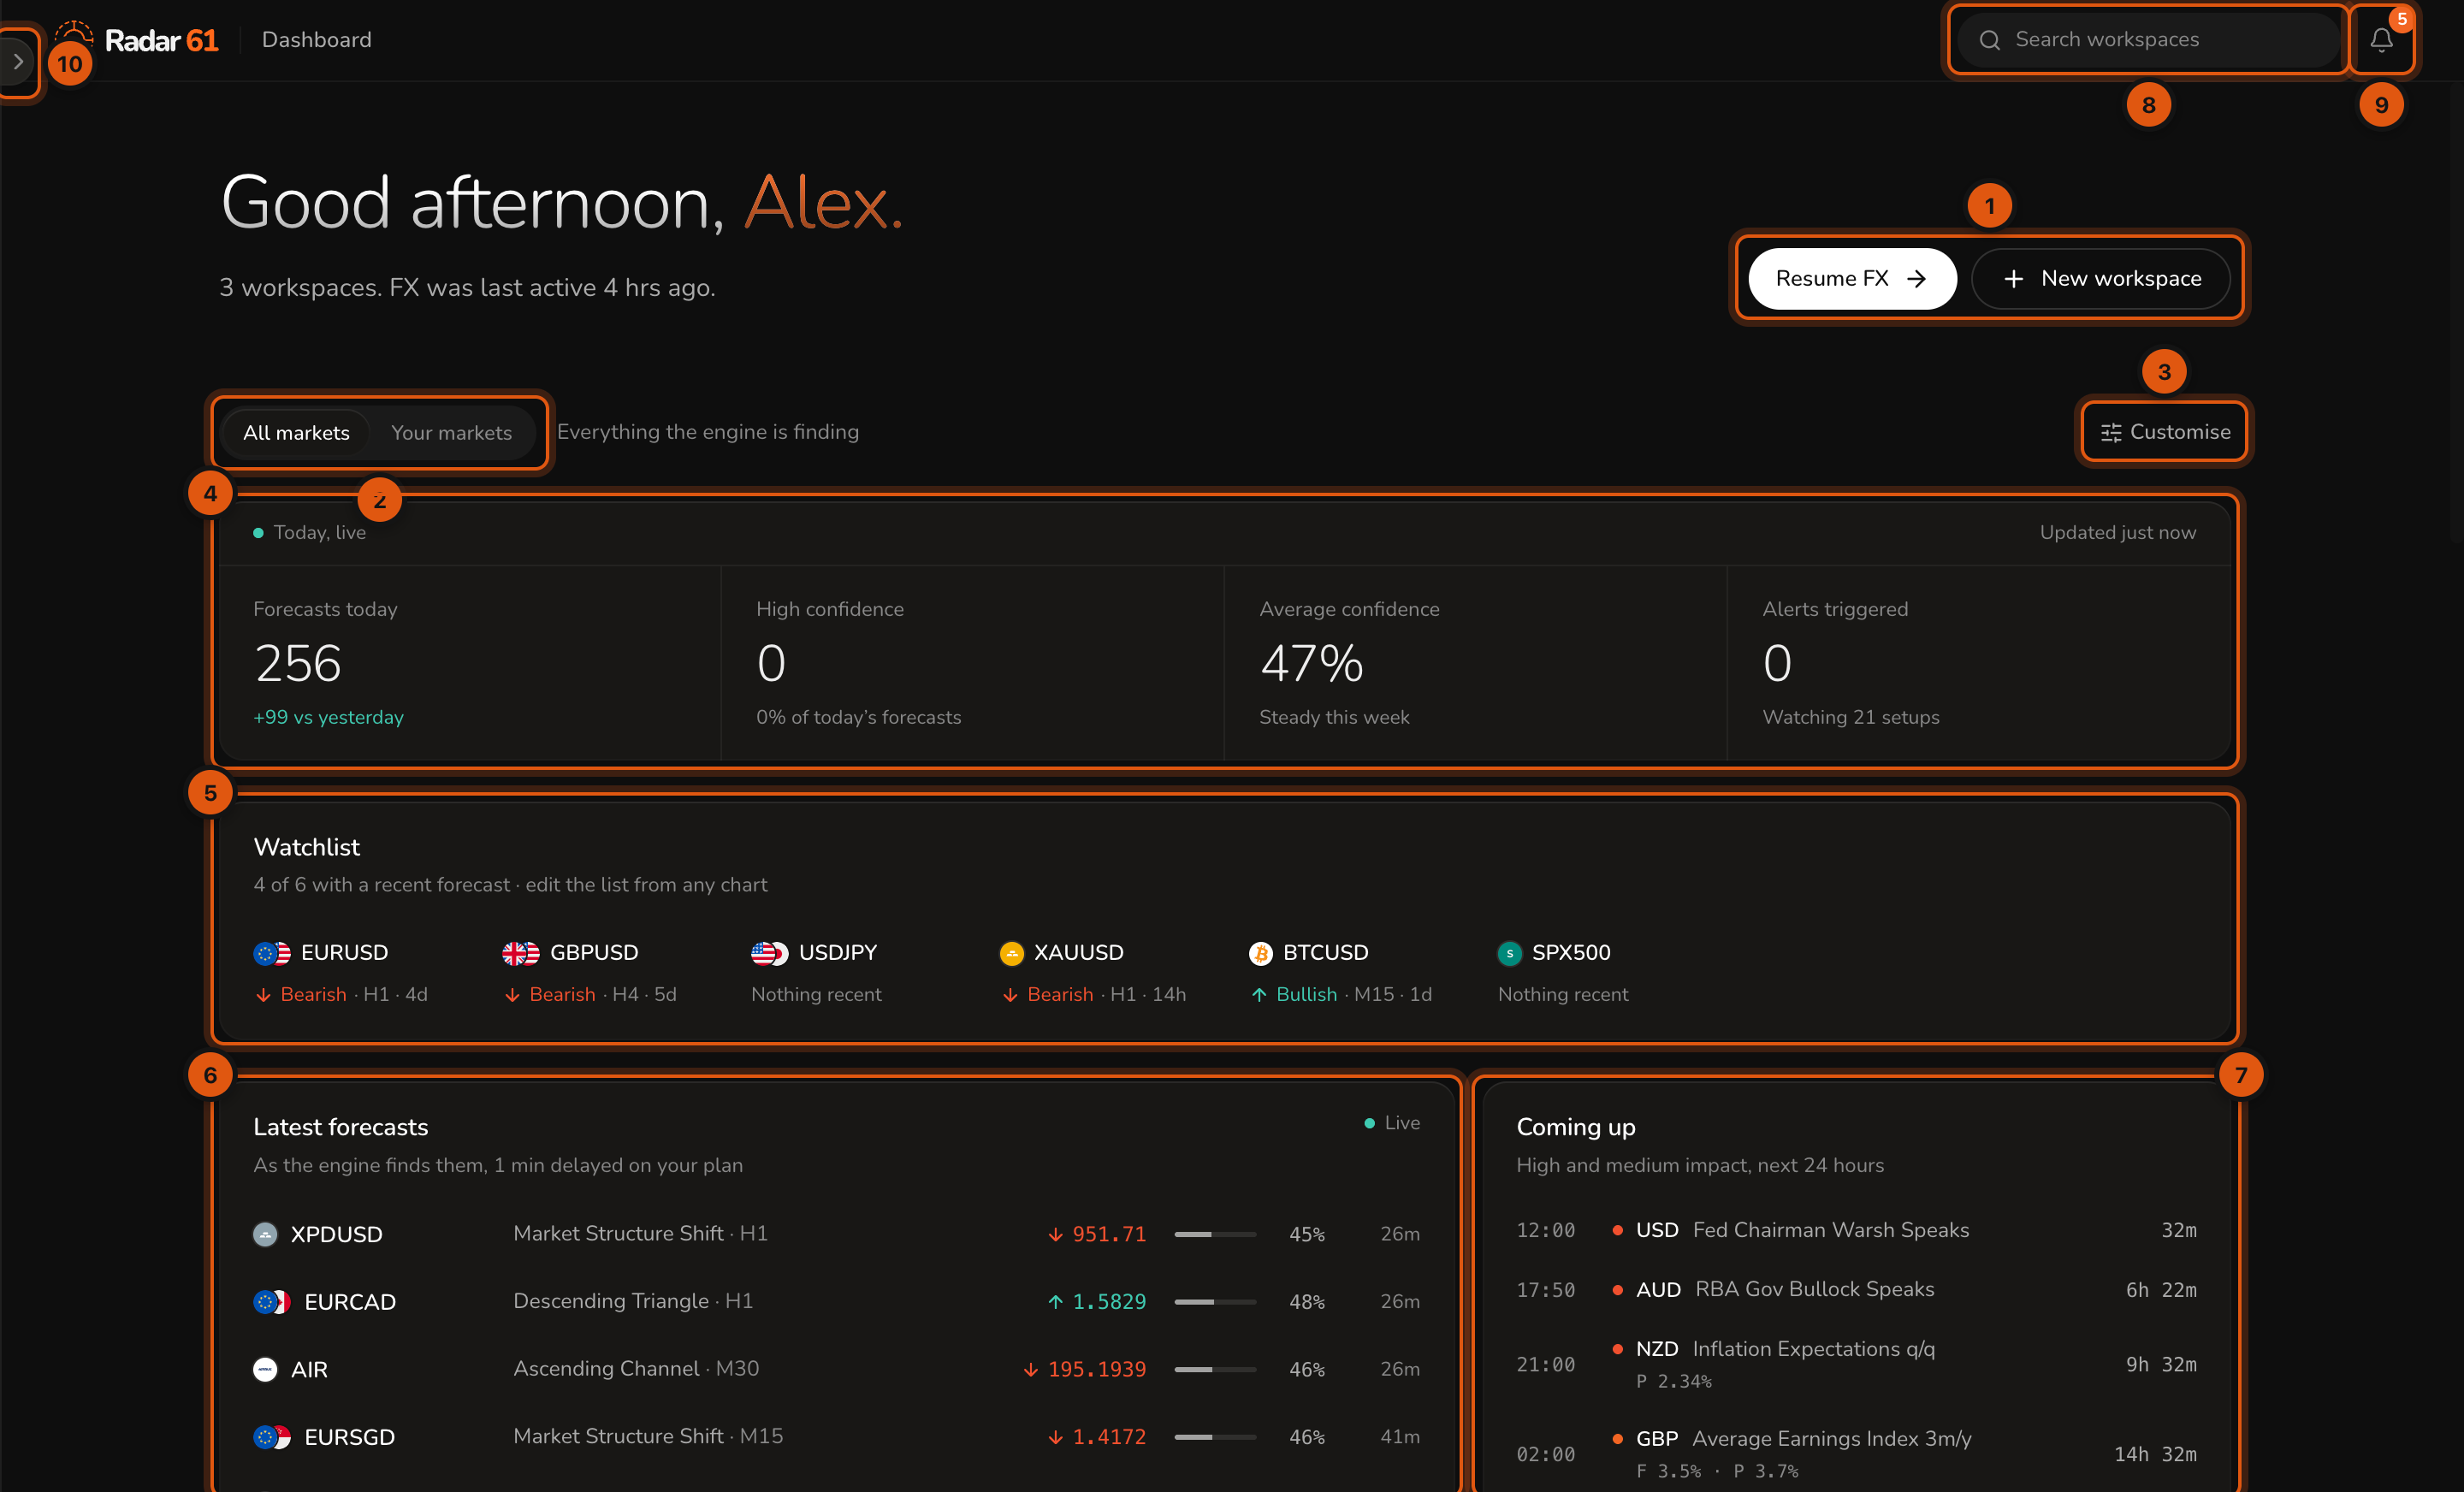
- Resume reopens the workspace you used last. New workspace creates one.
- All markets shows everything the engine is finding. Your markets narrows the page to the markets you trade, set in Trading defaults.
- Customise chooses which cards appear.
- Today, live: forecasts published today and the change against yesterday, how many are high confidence, the average confidence, and how many of your alerts have triggered.
- Watchlist: your watchlist instruments, with the most recent forecast direction, timeframe and age for each. Edit the list from any chart.
- Latest forecasts, newest first. Click one to open its chart, levels and track record.
- Coming up: high and medium impact economic releases in the next 24 hours.
- Search workspaces.
- Notifications.
- Opens the sidebar.
Further down
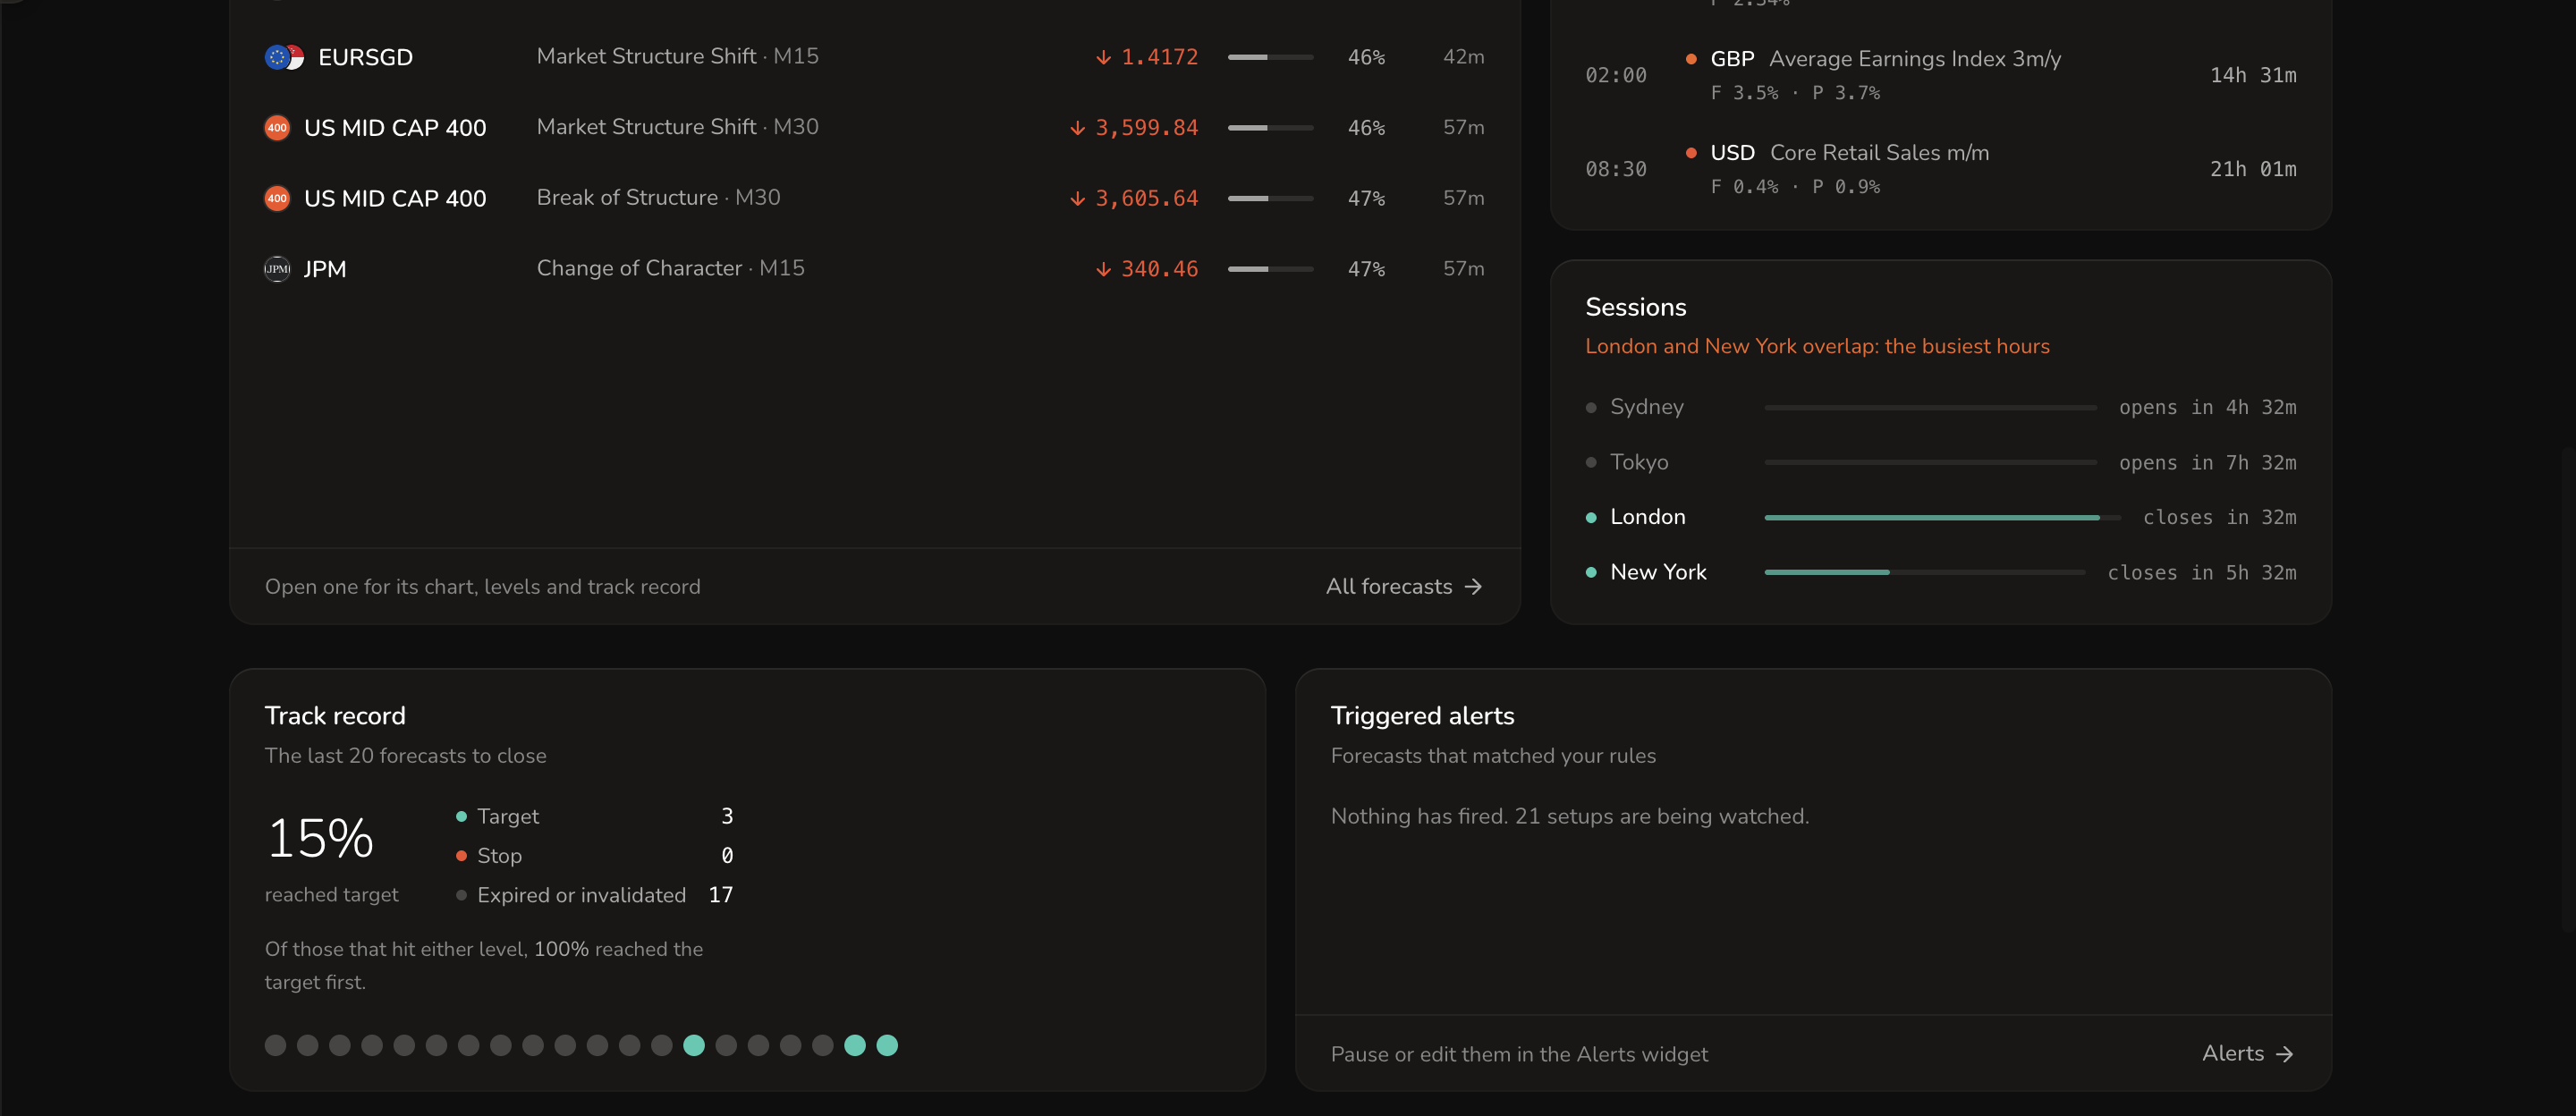
- Sessions shows Sydney, Tokyo, London and New York, when each opens or closes, and calls out overlaps, usually the busiest hours.
- Track record shows how the last 20 forecasts to close turned out: how many reached their target, hit their stop, or expired or were invalidated. Each dot is one forecast, oldest first.
- Triggered alerts lists forecasts that matched your alert rules. Pause or edit alerts in the Alerts widget.
- Headlines shows the latest stories from central banks, wires and market desks. See News Events.